Two Agents, Two Prices: How to Tell Which One Did the Work
Seller Resources
Seller Resources
You interview two agents. One says $565,000. One says $615,000. Same house, same week, same data available to both of them.
Most sellers resolve this the obvious way and list with the higher number. I understand the instinct completely, and it’s the single most expensive habit in residential real estate — because the two numbers usually aren’t two opinions about your house. They’re one piece of analysis and one piece of arithmetic, and you can tell which is which in about five minutes if you know what to look for.
A comparative market analysis is an agent’s estimate of what your home should list at and what it’s likely to sell for. It is not an appraisal, and in Texas that distinction has teeth.
When a licensed agent or broker gives you a price opinion, what you’re getting is an estimated sale price — not an opinion of market value. Those are different products with different standards behind them. An appraisal is an opinion of market value, performed by a licensed or certified appraiser under national standards, with a certification attached. A price opinion from an agent carries a required disclaimer saying, in so many words, that it is not the same thing.
I hold both licenses, so I’ll say the useful version: neither is better. They answer different questions. The appraisal is the one a lender relies on and the one that holds up in a courtroom. The CMA is the one that decides what you list at on Thursday, which is the decision actually in front of you.
What matters is whether the CMA in your hand was produced with the same care an appraisal would get, or whether it was produced in eleven minutes to win a listing appointment.
The quick way to build a CMA is to pull the recent sales near the property, work out an average price per square foot, and multiply it by your square footage.
That method is fast, it produces a number that looks reasonable, and it quietly treats the following as though they were noise:
Average those differences away and the output describes no actual house on the street, including yours.
This is the part almost no seller has been told, and it’s the reason a per-foot shortcut fails in a specific, predictable direction.
Smaller homes almost always carry a higher price per square foot than larger ones in the same neighborhood. A kitchen, the bathrooms, the mechanical systems, the roof, the foundation — a good deal of what a house costs doesn’t scale with size. Spread that across 1,400 square feet and the per-foot figure is high. Spread the same across 3,200 and it’s lower. It happens in essentially every neighborhood and it has nothing to do with quality.
So when somebody applies the neighborhood’s average per-foot figure to your house, the error isn’t random. If your home is larger than the average that produced the figure, the method overprices you. If it’s smaller, the method underprices you. Every time, in the same direction, and the further you are from average the worse it gets.
Here is what that looks like in real numbers. I pulled closed sales from two Fort Worth neighborhoods chosen to be as different as I could make them — a 1920s and ’30s pocket between Camp Bowie, Montgomery and I-30, and a subdivision built in the last eight years — and grouped each by house size.
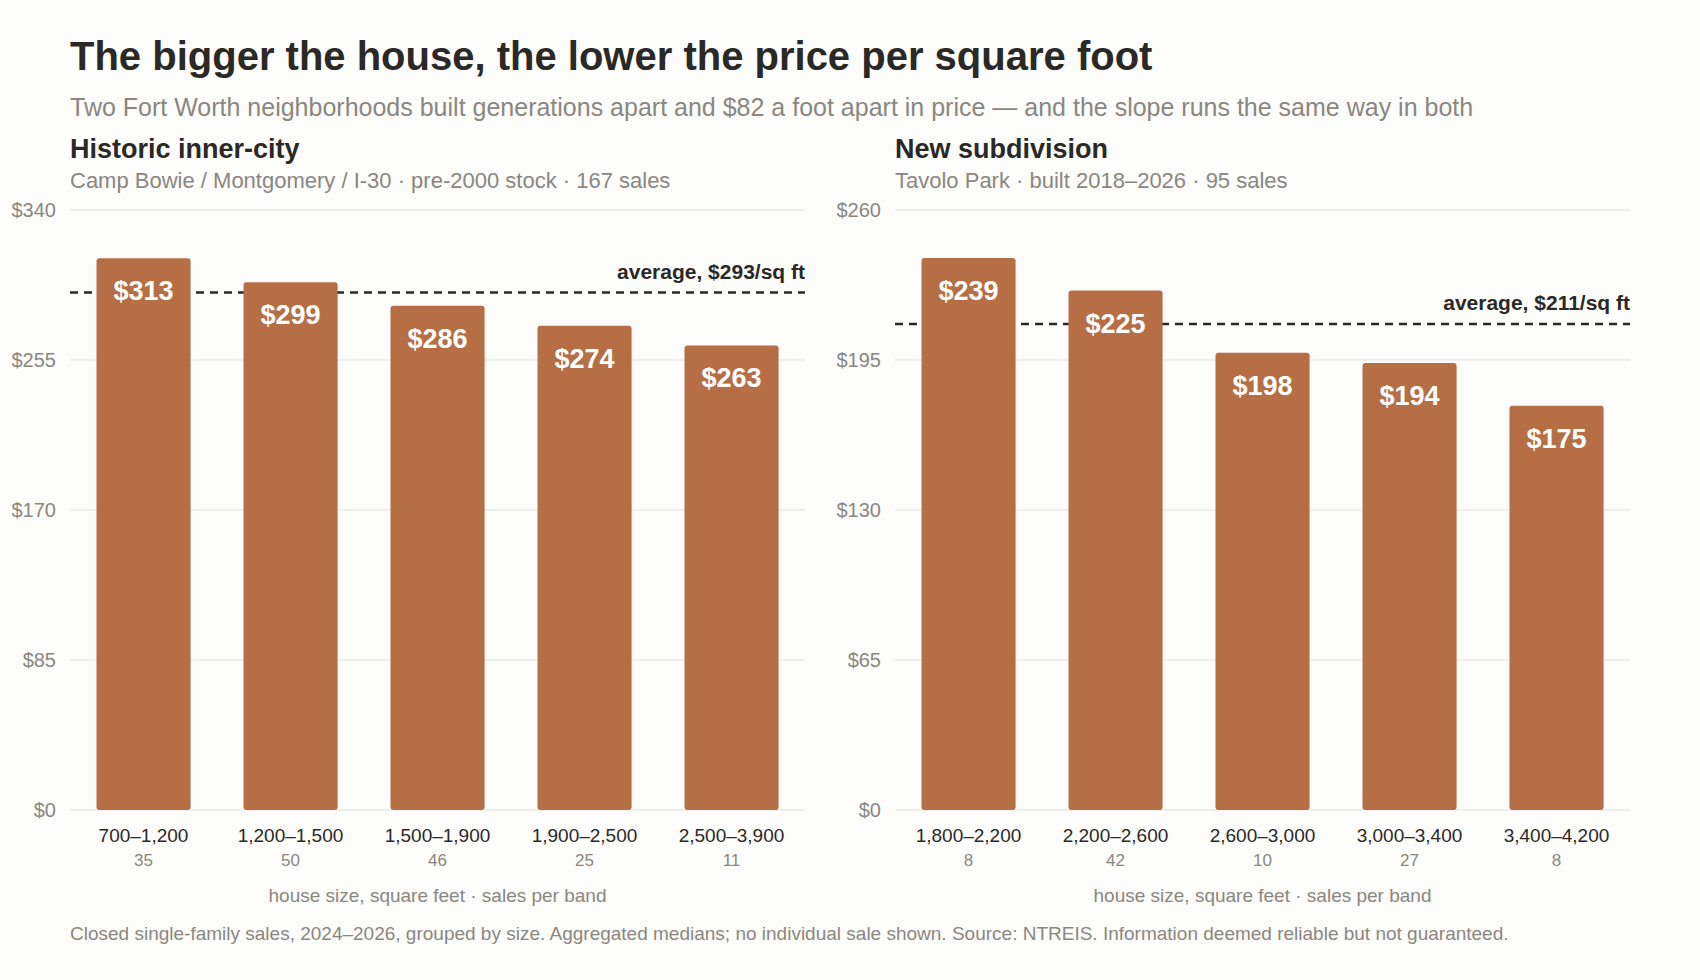
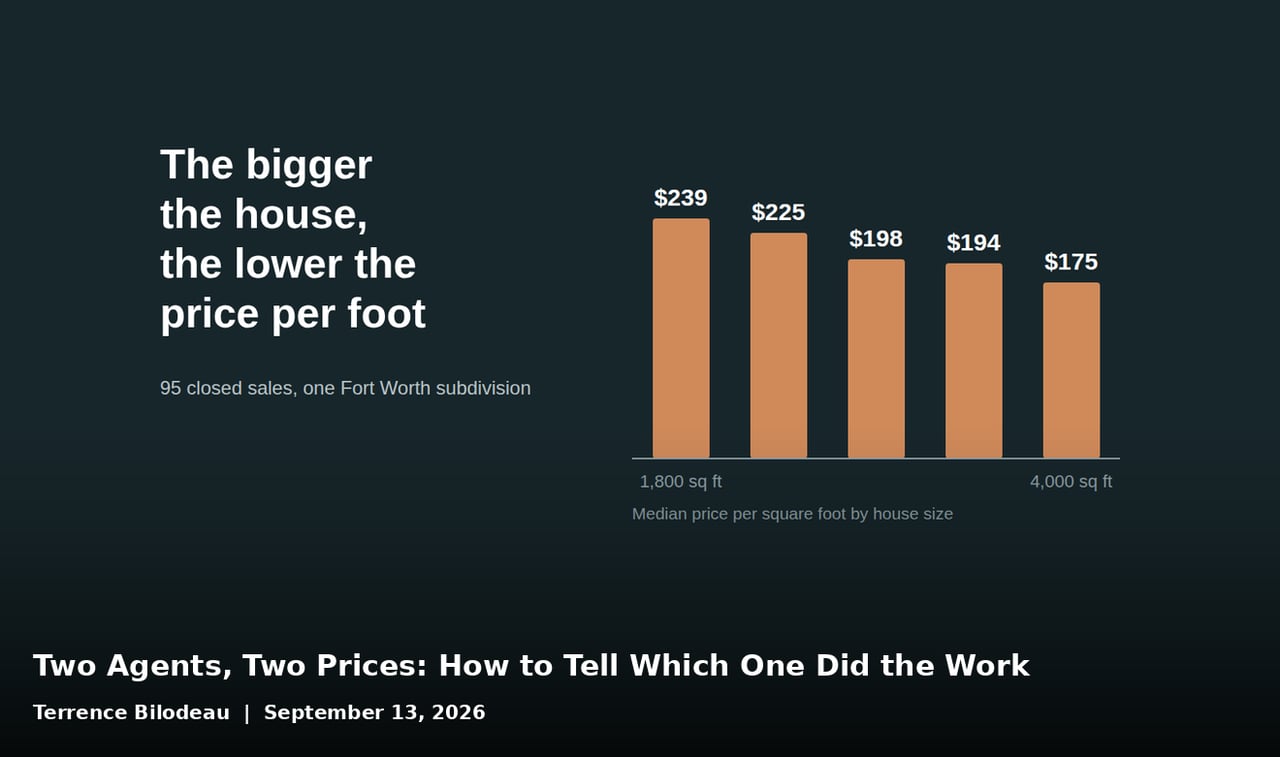
In the new subdivision, the smallest homes sold at a median of $239 per square foot and the largest at $175 — same builders, same years, a 27% spread produced by size alone. In the historic neighborhood, where houses sell for eighty dollars a foot more, the same slope runs from $313 down to $263.
Two markets with almost nothing in common, ninety years apart in construction, and the line points the same way in both.
Now watch what the shortcut does to it. Take the new subdivision, where the average is $211 per square foot. Apply that one figure to every house and here is the damage:
On a $650,000 house, that high side is a six-figure error, arrived at with a straight face and a defensible-looking number. And notice it isn’t random — it runs the same direction every time. The further your house sits from the neighborhood’s average size, the worse the method treats you.
One footnote that matters more than it sounds. The historic panel covers pre-2000 houses only, and that filter is doing real work. That pocket has had a lot of teardown-and-rebuild, and new construction sells at a premium per foot — so leaving the new builds in masks the size effect and makes the relationship look weaker than it is. Which is its own lesson about pricing: if you don’t check what else is moving with size, you can measure the wrong thing entirely and never know.
Price per square foot is a useful way to compare two homes that are already similar in size. It is not a pricing method, and it should never be the whole of one.
Both errors cost money. They just cost it differently, and only one of them is visible.
If your home is the better one and it gets underpriced, it sells. Quickly, probably with multiple offers, and everyone congratulates everyone. You will never find out what you left on the table, because nothing went wrong. This is the quiet one, and in my experience it is more common than sellers imagine.
If your home is the weaker one and it gets overpriced, it sits. And sitting is not neutral.
Your first two weeks on the market are the most valuable two weeks you will ever have. That’s when the buyers who have been watching this neighborhood for months — the ones already approved, already disappointed by three other houses — see your listing as new. Price it above what the evidence supports and you spend that audience on a number they won’t pay.
What follows is familiar. A price reduction at week four. Another at week eight. By then the listing carries days on market, and buyers who see it late read the history rather than the house: something must be wrong with it. Houses that go through that cycle very often close below what a correctly priced listing would have brought in the first month — after months of showings, and after you’ve been the one paying the mortgage the whole time.
The overpriced listing doesn’t get you more money. It costs you the buyers who were there at the start.
Not longer. Different.
Closed sales as the foundation. What buyers actually paid is the only hard evidence in the file. Everything else is context.
Pending sales for direction. They tell you where the market is heading right now, ahead of the closings. In a moving market they matter enormously, and they arrive months before the sold data catches up.
Active listings read as competition, not as value. An asking price is a ceiling, not a value — almost nobody asks less than they would take. What the actives really tell you is what your buyer will be choosing between when they walk through your door, and how many of them there are.
Withdrawn and expired listings, which most people skip. Those are the numbers the market was shown and declined. If three homes like yours failed to sell at a given price, that’s evidence — often better evidence about the ceiling than anything that did sell.
Adjustments that are explained rather than asserted. Your house has a third bay and the comparable doesn’t. Fine — what is that worth here, in this price range, and where did that figure come from? The honest answer is sometimes a range, and sometimes it’s zero, and zero is a real finding rather than a shrug.
Somebody who has actually been inside. Condition and finish are half of what separates two houses with identical specifications, and neither of them is in the data.
Ask these of whoever is pricing your home. It takes five minutes and it tells you nearly everything.
1. Which specific properties did you use, and why those? You want addresses and reasoning. “Recent sales in the subdivision” is not an answer. A good agent will also tell you which ones they deliberately excluded and why, which is often the more revealing half.
2. How is my house different from each of them, and what did you do about it? This is the whole job. If every comparable were identical to your house you wouldn’t need anybody — you’d need a calculator.
3. What would have to be true for this to be wrong? A confident answer to this question is the best sign you’re dealing with someone who thought about it. “If the two pending sales close below list, I’d want to revisit” is a real answer. “It won’t be wrong” is not.
4. What’s the plan if we’re wrong? At what point do we know, and what do we do then? Deciding that in advance, when nobody is emotional, is worth more than a slightly better starting number.
Sometimes the supported number is lower than the seller was hoping for.
An agent who knows that and quotes you a higher figure anyway is not being optimistic. They’re winning a listing appointment, and the market will correct them in about thirty days — except by then it’s your listing wearing the days on market, not theirs.
I’d rather have the harder conversation up front. Sometimes it changes the plan: a different launch date, a specific repair, a staging decision, or occasionally the honest conclusion that this isn’t the right season to sell. Those are all better outcomes than finding out in October what was true in June.
If you want the longer version of how these adjustments actually get measured — and why the same feature is worth different amounts in different neighborhoods and different years — I wrote that up on my appraisal practice’s site. Read it here.
I’m a licensed Texas broker and a Certified Residential Appraiser. When I price a home, it’s the same analysis I’d perform if a lender or an attorney were going to rely on it — and you get to see the work, including the parts that argue against the number you were hoping for.
That’s the approach The Bilodeau Group brings to every listing, and it matters most in the transactions where the comparable sales don’t tell the whole story: unusual properties, estates and probate sales, divorce, partial interests, and homes that have been renovated well past what the neighborhood normally supports.
Call or text (682) 207-4310, or send me a note. Happy to look at your specific situation before you commit to anything.
 Tanglewood
 Crestwood
 Walsh Ranch
 Montserrat / Montrachet
 Bella Flora
 Edwards Ranch Riverhills
 Tavolo Park
 Ryan Place
 Fairmount
 Ridglea
 Ridglea North
 Ridgmar
 Westover Hills
Rivercrest Bluffs & River District
Westover Hills
Rivercrest Bluffs & River District
 Rivercrest, Monticello & North Hi Mount
 Mira Vista
Overton Park
Overton Woods
Westcliff
Arlington Heights
Benbrook
Ventana
Downtown
Linwood
Eagle Mountain & Marine Creek
Beltmill & Watersbend
Heritage & Alliance
Presidio & Tehama Ridge
Wedgwood
North Richland Hills
Hurst
Euless
Bedford
Grapevine
Westlake
Keller
Southlake
Colleyville
Arlington
Burleson
Crowley
Mansfield
Kennedale
Aledo
Weatherford
Azle
Granbury
Springtown
Cleburne
Joshua
Godley
Alvarado
Ponder
Krum
Waxahachie
Midlothian
Poolville
Decatur
Justin
Mira Vista
Overton Park
Overton Woods
Westcliff
Arlington Heights
Benbrook
Ventana
Downtown
Linwood
Eagle Mountain & Marine Creek
Beltmill & Watersbend
Heritage & Alliance
Presidio & Tehama Ridge
Wedgwood
North Richland Hills
Hurst
Euless
Bedford
Grapevine
Westlake
Keller
Southlake
Colleyville
Arlington
Burleson
Crowley
Mansfield
Kennedale
Aledo
Weatherford
Azle
Granbury
Springtown
Cleburne
Joshua
Godley
Alvarado
Ponder
Krum
Waxahachie
Midlothian
Poolville
Decatur
Justin
Stay up to date on the latest real estate trends.

H-E-B is coming to Chisholm Trail and Oakmont in late 2028. I measured six North Texas stores to find out what that does to home values. It doesn't — but it changes ho… Read more
Home Improvement
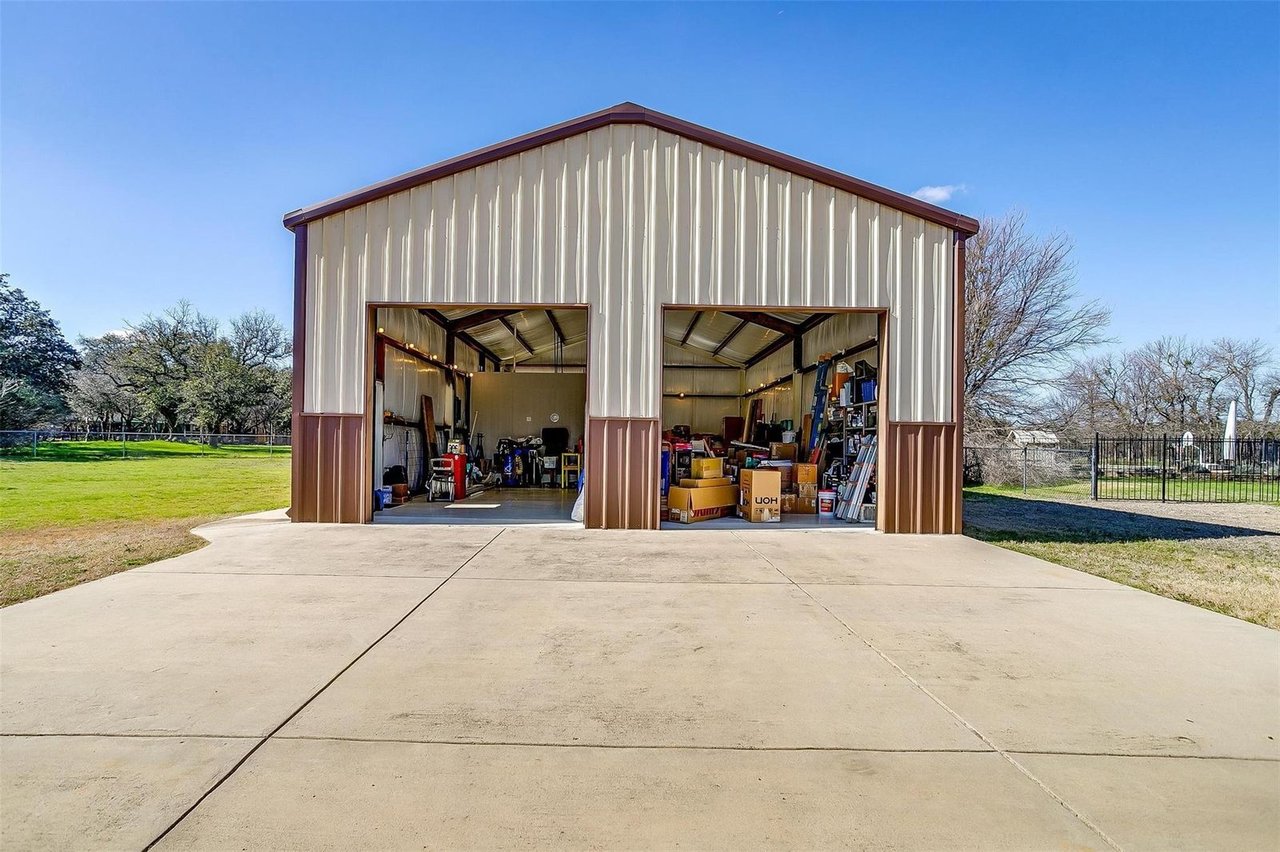
A shop with electricity adds about 6% of the sale price. The same building without power adds 2.6% — the same as a storage shed.
Home Improvement
2,002 accessory units measured. Having one adds about 7% — and how big it is adds nothing, so build the smallest one that does the job.
Seller Resources
Your old days on market follow you until you've been gone 30 days — then they vanish completely. 16,465 relisted DFW houses measured.

Home Improvement
About 9% of your price almost regardless of neighborhood — half to all of what one costs to build. And they sell eight days faster.
Buyer Resources
On a new build the listed tax is the vacant lot's bill, and it roughly quadruples in year two — about $526 a month on a $450,000 house.
Buyer Resources
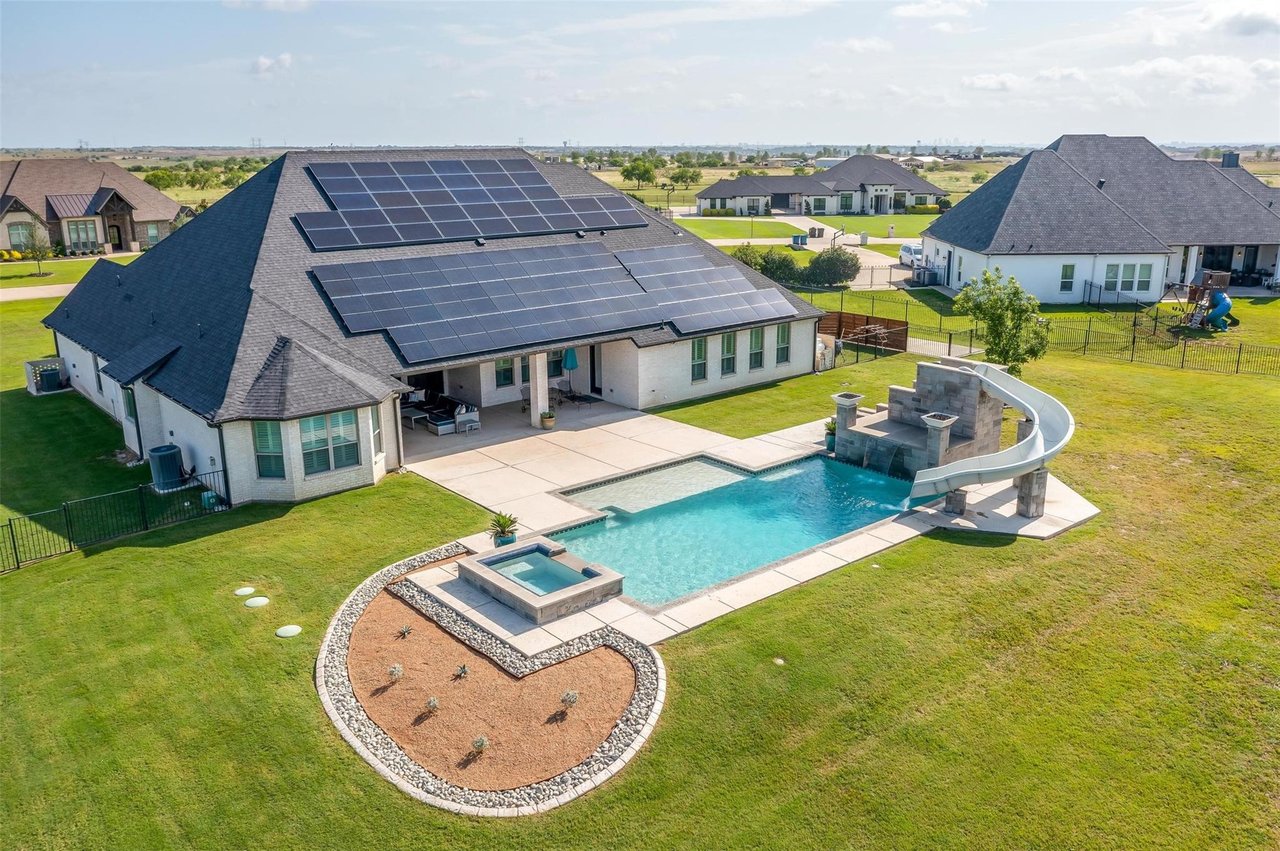
Owned panels add about 3%. Leased panels add nothing — and a listing that doesn't say which gets priced like a lease.

Seller Resources
Your twenty acres are not worth ten times your neighbor's two. Per-acre price falls about a quarter every time a tract doubles.
Owner Resources
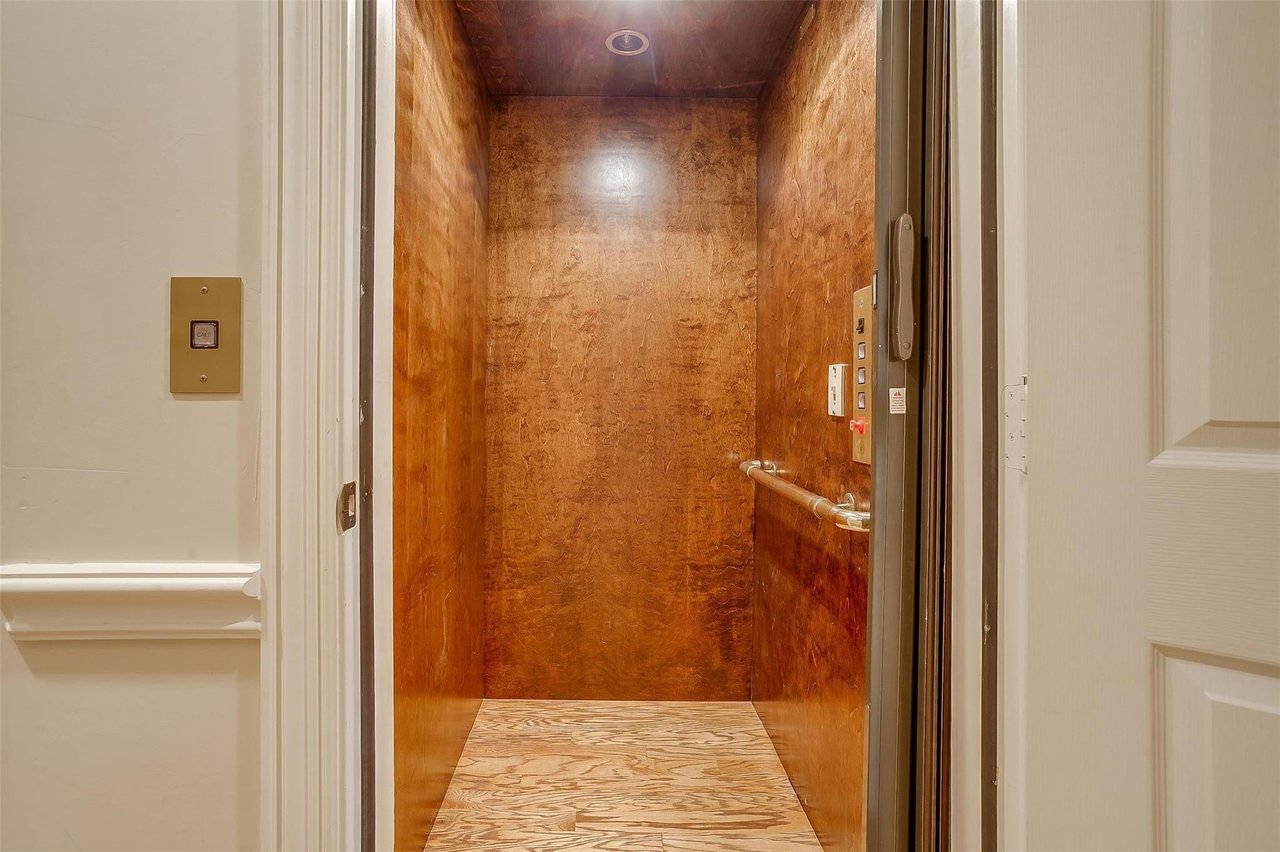
I listed one in North Richland Hills that sold in nine days at 99% of asking. The elevator wasn't why — and 121 sales out of 89,302 show why not.
I've trained three appraisers in this market, and every figure on this blog comes from closed sales I pull and model myself. The same analysis, applied to one address.