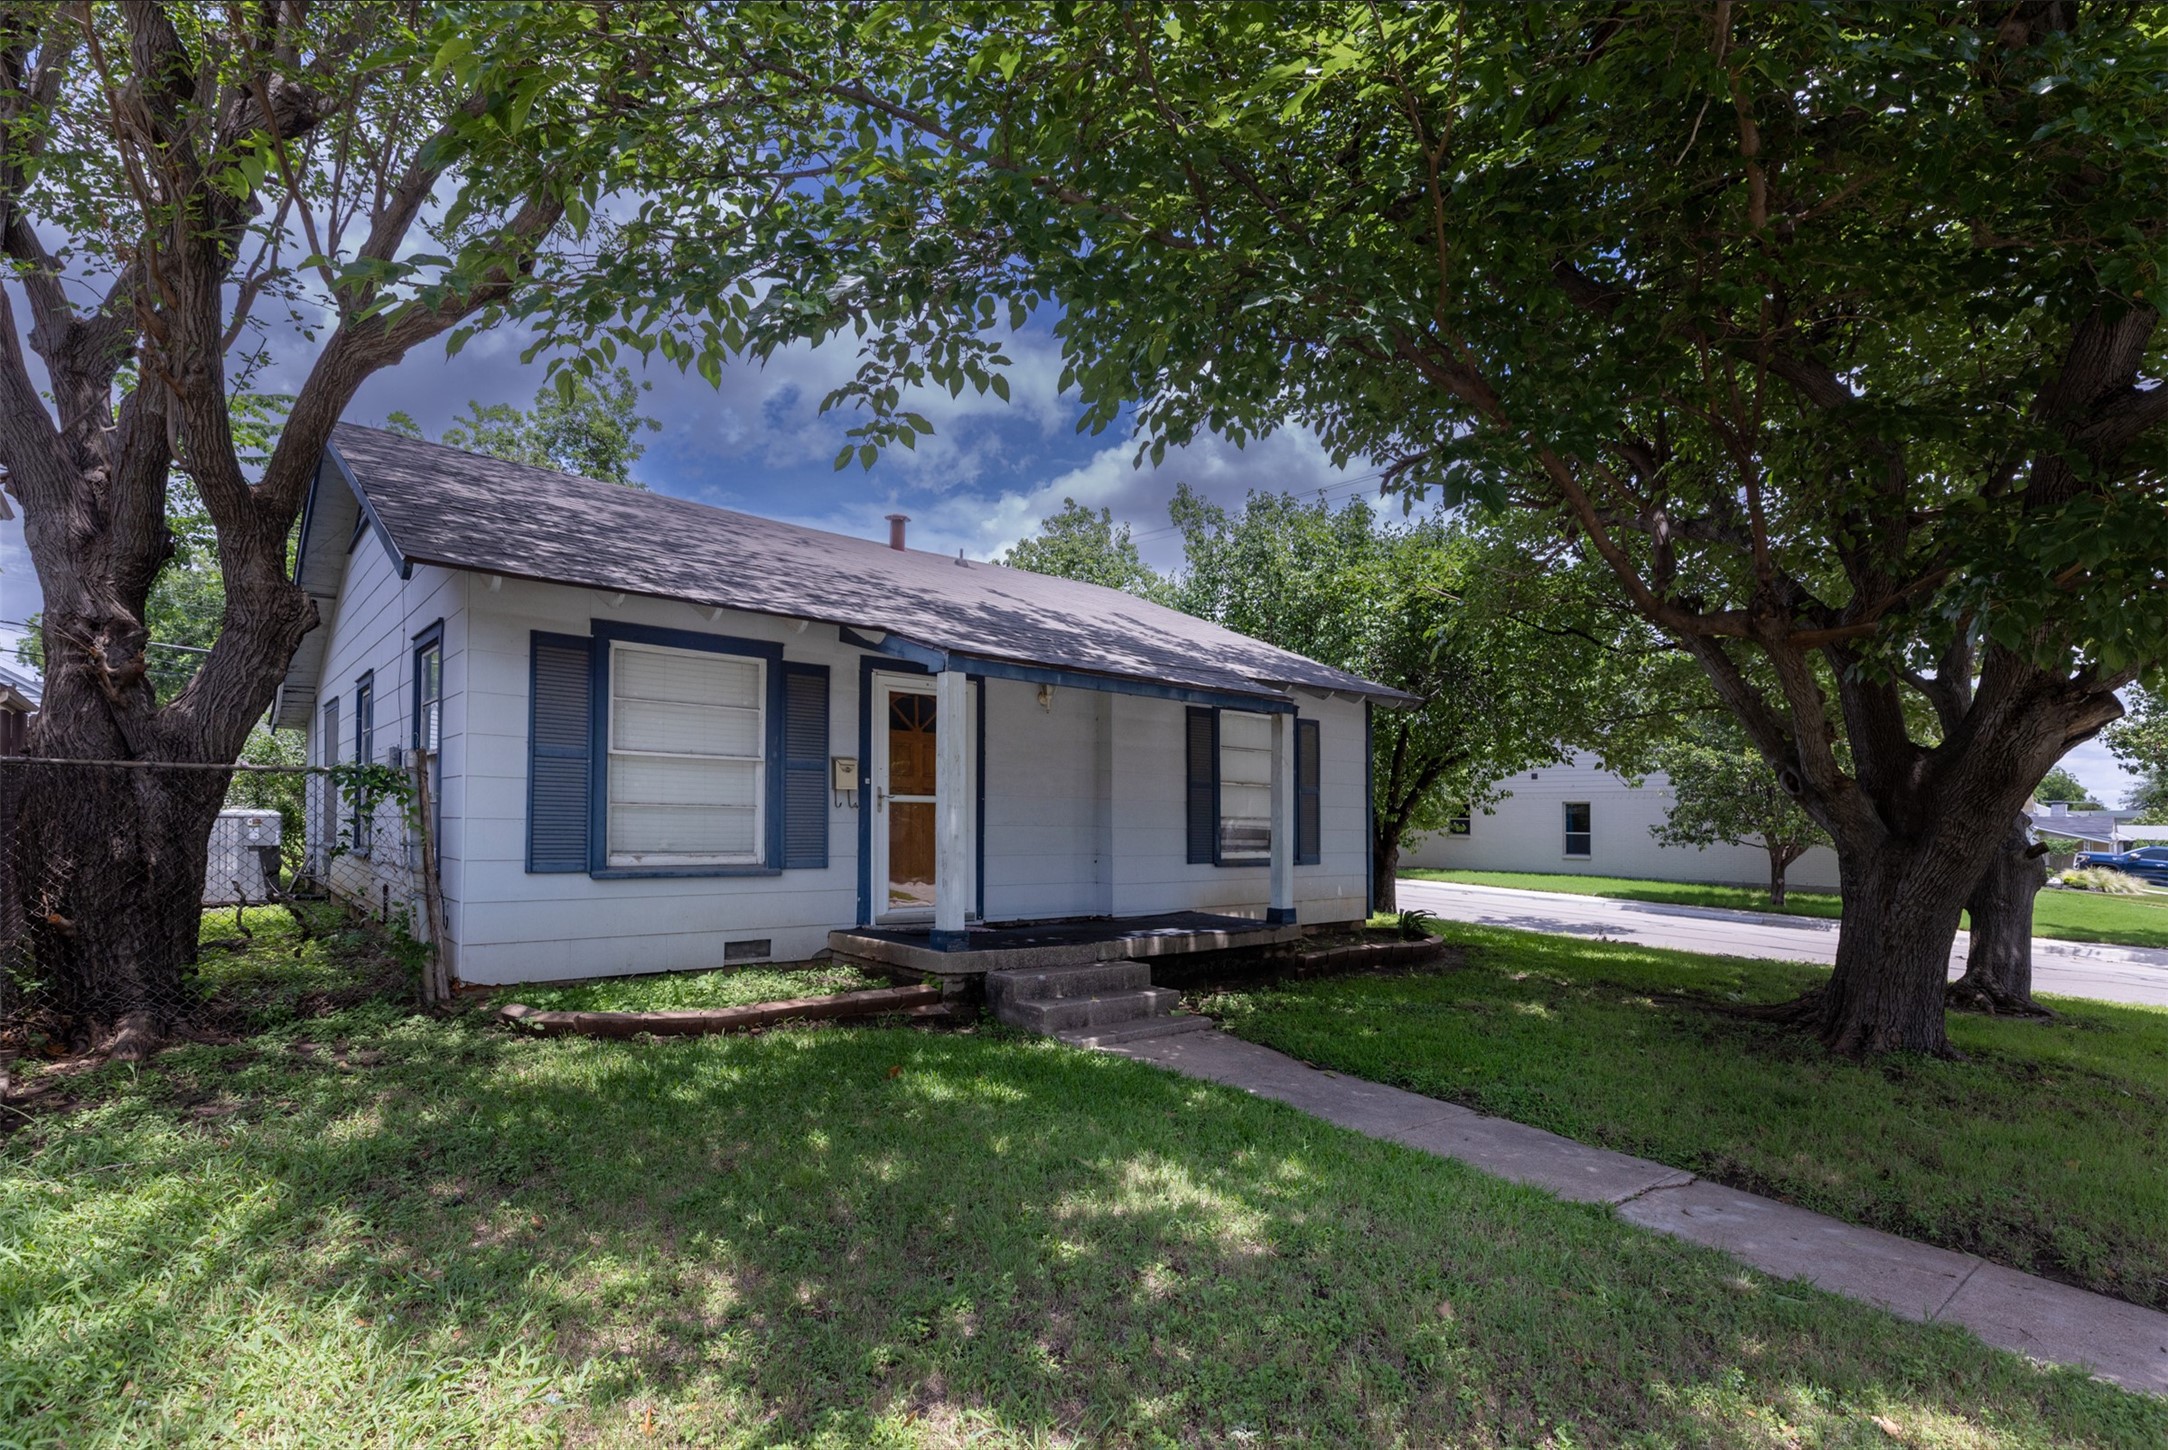
Arlington Heights is one of Fort Worth's oldest west-side neighborhoods — platted at the turn of the last century, built out mostly in the 1920s through the 1940s, and running along the Camp Bowie corridor between the Cultural District and the western edge of town. Bungalows, Tudors and small brick cottages on compact lots, with the Botanic Garden, the museums and downtown all a short drive east.
It is also large. About 9,019 people live inside the boundary — three to four times the population of most neighborhoods I write about — and over the three years ending September 2026 it produced 798 listings and 428 closed sales. Roughly 130 sales a year.
I'm a Fort Worth broker and a Certified Residential Appraiser. At that size, the neighborhood median is almost useless, and this page is mostly about why.
Interstate 30 is the single biggest line in this neighborhood
Homes on either side of the freeway carry the same name, the same school district and a similar vintage. They do not carry similar values.
- North of I-30: 293 closed sales, median $455,000 — about $292 per square foot — in 18 days at 98% of original list
- South of I-30: 135 closed sales, median $275,000 — about $214 per square foot — in 36 days at 94% of original list
That's a 36% gap in price per foot and a 65% gap in total price, and it is about as statistically solid as residential data gets — the difference holds at p < 0.000001.
The listings tell the same story. 45% of listings south of the freeway came off the market without selling, against 32% north of it, and the southern homes take twice as long and concede four more points of asking price when they do trade.
Both halves are genuinely Arlington Heights. Any estimate built on the whole neighborhood is roughly a third too high for one side and a third too low for the other.
And a second gradient runs east to west
Underneath the freeway split there's a steady east-west slope, running down from the Cultural District end toward the western edge.
- Far east: $291 per foot
- East: $268
- Middle: $260
- West: $250
- Far west, past Hulen: $205
Put the two axes together and the neighborhood sorts into four quite different markets:
| Median price | $/sq ft | Days |
North of I-30, east | $463,500 | $292 | 15 |
North of I-30, west | $401,250 | $284 | 27 |
South of I-30, east | $288,750 | $248 | 35 |
South of I-30, west | $252,500 | $200 | 36 |
Northeast corner to southwest corner is a 46% difference in price per square foot, and more than twice the time on market.
Size and lot barely matter here
This is worth saying plainly because it runs against how most people estimate a house.
The correlation between square footage and price per foot is −0.11. Between lot size and price per foot it's 0.06. Neither predicts anything meaningful — and that's partly because the lots here are remarkably uniform, a median of 6,273 square feet across essentially every part of the neighborhood.
Location does the work instead. Latitude correlates at 0.42, longitude at 0.30. In Arlington Heights, which corner you're in explains value and the house itself explains much less than you'd expect.
A third of listings come off the market — and not for the obvious reason
292 of 798 listings — 37% — were cancelled, expired or withdrawn, and those 798 listings come from 586 distinct properties, so a fair number came to market more than once. In a neighborhood where most owners have substantial equity and no deadline, that's less alarming than it sounds: it's what happens when a number doesn't materialize and the owner would rather stay than chase it.
What's interesting is what they were asking: a median of $257 per square foot, which is below the $269 that sales actually cleared, at a median price of $375,000 against a $393,450 median close.
So these weren't ambitious sellers. By any neighborhood-wide measure they were priced under the market — which is exactly the problem, because the neighborhood-wide measure is the wrong yardstick here. A house in the southwest quadrant asking $257 a foot is asking nearly thirty percent over its local market. A house north of the freeway on the east side asking the same number is leaving a similar margin on the table. Same figure, opposite errors, and neither is visible without splitting the neighborhood up.
Those listings sat a median of 88 days before coming off. Homes priced to their actual corner went in about three weeks at 96.5% of asking.
What the market is actually doing
Worth setting the context, because a neighborhood this big gets talked about in generalities. Arlington Heights has the largest sales record of any neighborhood I track — 428 closed sales over three years — which is enough to measure a trend properly rather than guess at one. Controlling for house size, price per square foot here has moved −0.7% a year, with a p-value of 0.66. That is flat. Not falling: flat, and with this much data a real decline would have shown up.
What changed is speed and patience, not value. Homes take longer than they did in 2022 and more listings come off the market without selling — which, in a neighborhood where owners hold decades of equity, mostly means they'd rather stay than chase a number. I track eighteen Fort Worth neighborhoods, and not one of them shows a statistically significant decline in price per foot. For a buyer that means room on terms that didn't exist three years ago. For a seller it means the list price carries more weight than it used to.
The practical stuff
All but one of the 798 listings are Fort Worth ISD. A neighborhood this large spans several elementary attendance zones, and the boundaries don't follow the subdivision name — confirm the assignment for a specific address with the district.
Most of Arlington Heights has no HOA (only 47 of 798 listings showed a fee, largely the condo and townhome projects) and there's no PID. Taxes across closed sales ran about 1.96% of purchase price.
70 of the 798 listings are townhomes or condos, interleaved with single-family homes and filed under the same neighborhood name. And only about 7% of homes have a pool, which is very low — on 6,200-square-foot lots, most simply don't fit one. A pool here is genuinely unusual and priced accordingly.
Closed prices across the neighborhood ran $125,000 to $1,194,685, on homes with a median of just 1,469 square feet built around 1943. This is a neighborhood of small old houses with a very wide value range, and the range is geography.
What I look at in an Arlington Heights house
- Which side of I-30, and how far east. That's a 46% swing on price per foot before anything else is considered.
- What a renovation actually touched. These are eighty- to hundred-year-old houses. New finishes over knob-and-tube remnants, galvanized supply and an unexamined pier-and-beam foundation is a different asset. Ask for permits, not photographs.
- Foundation and drainage. Pre-war construction on North Texas clay, most of a century in.
- Additions and their approvals. Very common on houses this small, and frequently unpermitted. An appraiser treats that square footage differently than a listing does.
- Attached or detached. Condos and townhomes sit inside the same boundary and aren't comparable to a 1930s bungalow.
- The elementary zone for that specific address.
If you're selling in Arlington Heights
The good news is that this is a fast neighborhood when the number is right — north of the freeway, homes go in about two weeks at 98% of asking, and that hasn't changed.
The work is all in identifying which of the four markets your house sits in and pricing to that. Remember that the listings that came off were asking below the neighborhood average, so the average is not the safe choice it appears to be. Getting the corner right is worth more here than anything you'll do to the house.
Buying or selling in Arlington Heights
Nine thousand people, 130 sales a year, a price range from $125,000 to nearly $1.2 million, four distinct markets separated by a freeway and a longitude, square footage that predicts nothing, and a single subdivision name over all of it.
That is a valuation problem before it's a marketing problem. Holding a Texas broker's license alongside a Certified Residential Appraiser certification is why I can tell you which Arlington Heights your house is actually in.
Call or text (682) 207-4310, or send me a note.
Sales figures are medians from NTREIS listings and closed sales for the three years ending September 2026, reported in aggregate. Tax rates, school attendance boundaries and market conditions change — confirm current figures and assignments for a specific property before relying on them.