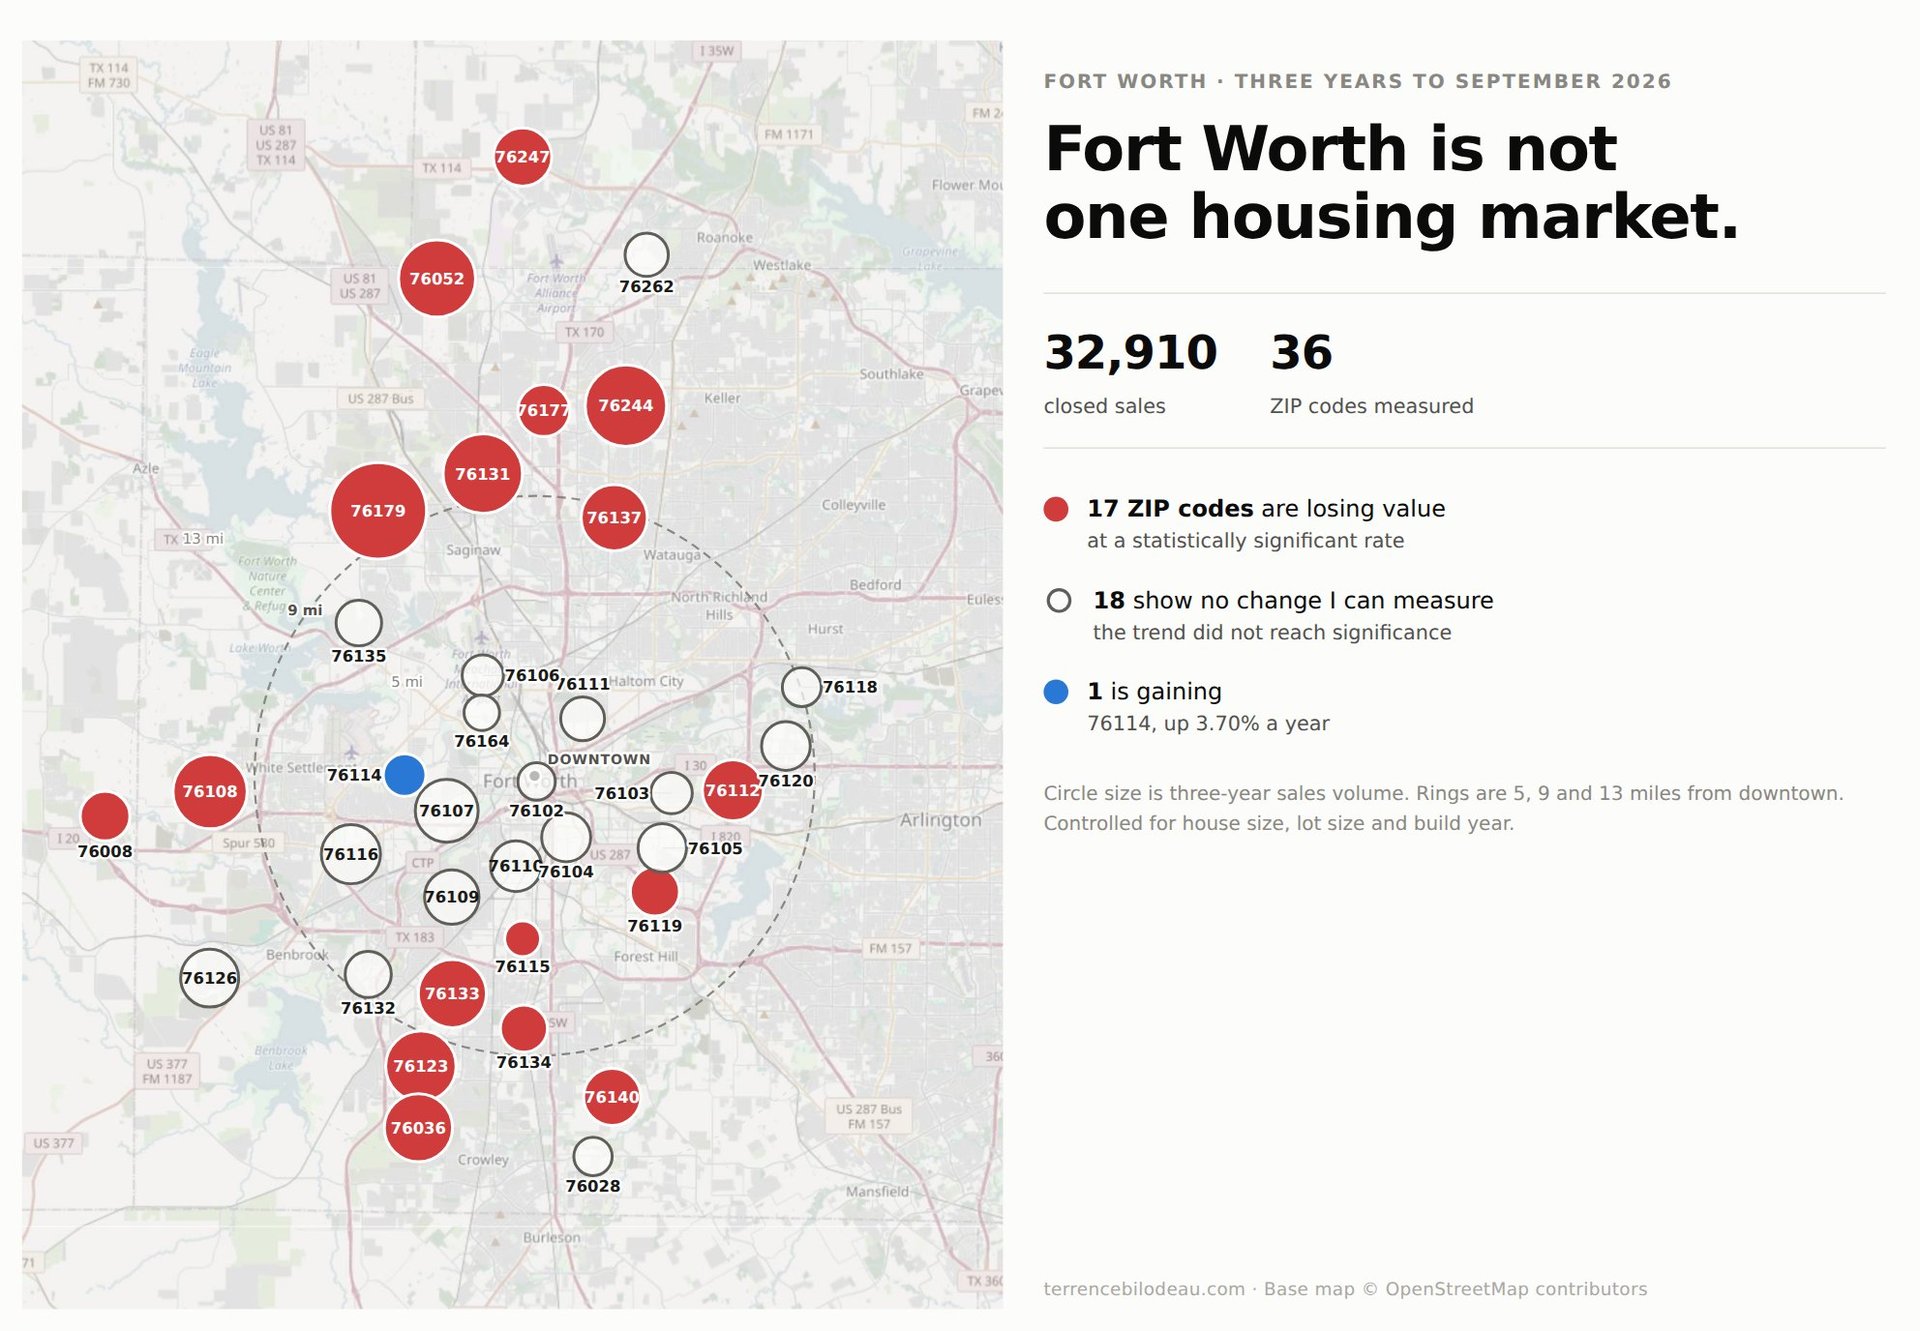
Fort Worth is not one housing market. Over the three years ending September 2026 the city closed 32,910 sales across 36 ZIP codes with enough volume to measure — and they are not moving together. Seventeen are losing value at a statistically significant rate. One is gaining. The other eighteen are flat.
Most ZIP code maps are a navigation device. This one carries the finding: each circle is sized by how many homes actually sold there and coloured by what the sales say values are doing, after controlling for house size, lot size and build year. The table below has every number, and the areas I cover in depth link through.
Base map © OpenStreetMap contributors. Circle positions are the median latitude and longitude of each ZIP's sales, not official postal boundaries.
Every measurable ZIP code in Fort Worth
Sorted by sales volume. “No change measured” means exactly that — the trend did not reach statistical significance, so I am not going to claim a direction.
ZIP | Area | Sales | Miles | Median | $/ft | Annual trend |
3,658 | 9.9 | $344,500 | $173 | -1.03% | ||
2,355 | 12.2 | $394,000 | $174 | -1.32% | ||
2,215 | 9.8 | $347,900 | $177 | -0.86% | ||
76052 | Haslet — Sendera Ranch, Wellington | 2,040 | 16.3 | $363,245 | $173 | -0.72% |
76108 | White Settlement & Chapel Creek | 1,843 | 10.4 | $325,000 | $180 | -1.42% |
76123 | Tavolo Park & Summer Creek Ranch | 1,610 | 10.0 | $312,000 | $156 | -1.59% |
1,474 | 7.5 | $280,000 | $160 | -1.99% | ||
76036 | Crowley & Chisholm Trail Ranch | 1,471 | 11.9 | $345,990 | $174 | -1.54% |
76137 | Park Glen & Summerfields | 1,349 | 8.7 | $325,000 | $175 | -0.97% |
76107 | Arlington Heights, Crestwood & Monticello | 1,178 | 3.0 | $441,200 | $271 | no change measured |
76112 | Woodhaven & Meadowbrook | 1,065 | 6.4 | $260,000 | $159 | -2.87% |
990 | 6.4 | $343,250 | $205 | no change measured | ||
76247 | Justin & Northlake — Wildflower Ranch | 945 | 19.8 | $369,900 | $178 | -2.97% |
76126 | Benbrook, Ventana & Montserrat | 924 | 12.3 | $525,000 | $209 | no change measured |
76140 | Eagles Crossing & Orchard Village | 881 | 10.6 | $280,000 | $175 | -4.68% |
76109 | TCU, Westcliff & Bluebonnet Hills | 769 | 4.7 | $665,000 | $293 | no change measured |
663 | 11.7 | $385,000 | $174 | -0.92% | ||
76110 | Fairmount, Ryan Place & Berkeley | 619 | 3.0 | $375,000 | $235 | no change measured |
578 | 13.8 | $549,820 | $207 | -3.23% | ||
76104 | Near Southside & the hospital district | 557 | 2.2 | $240,000 | $179 | no change measured |
76119 | Eastwood & Sierra Vista | 550 | 5.4 | $227,937 | $170 | -3.28% |
76120 | Mockingbird Estates & east Fort Worth | 543 | 8.1 | $330,000 | $180 | no change measured |
76105 | Polytechnic Heights | 529 | 4.7 | $227,000 | $173 | no change measured |
76134 | Hallmark, Lincolnshire & Camelot | 482 | 8.1 | $260,000 | $159 | -2.24% |
76132 | Mira Vista & Hulen Bend | 457 | 8.3 | $400,042 | $185 | no change measured |
76135 | Lake Worth & Marine Creek Estates | 435 | 7.5 | $310,000 | $174 | no change measured |
76111 | Oakhurst, Riverside & Sylvan Heights | 379 | 2.4 | $269,900 | $189 | no change measured |
76262 | Roanoke — Seventeen Lakes & Chadwick Farms | 361 | 17.1 | $430,000 | $189 | no change measured |
76114 | River Oaks, Rivercrest & Sunset Acres | 345 | 4.2 | $270,000 | $186 | +3.70% |
76103 | Handley & White Lake Hills | 310 | 4.4 | $259,000 | $161 | no change measured |
76106 | Northside & Rosen Heights | 306 | 3.6 | $245,000 | $181 | no change measured |
76118 | River Trails | 246 | 9.0 | $365,000 | $198 | no change measured |
76028 | Burleson — Thomas Crossing, Deer Meadow | 231 | 12.4 | $328,000 | $174 | no change measured |
210 | 0.2 | $362,500 | $297 | no change measured | ||
76115 | Seminary Hill & Greenbriar | 174 | 5.2 | $200,000 | $173 | -4.41% |
76164 | Northside & Rosen Heights (north) | 168 | 2.6 | $245,000 | $176 | no change measured |
How to read this
The big red circles on the north and south edges are where the volume is. Eagle Mountain, Heritage, Beltmill and Wedgwood alone account for nearly 10,000 sales, and all four are declining. That is not a coincidence of geography — it is where the affordable housing and the new construction both sit.
The hollow circles cluster near the centre. Close-in, established, higher-priced Fort Worth is holding its value. Downtown, Arlington Heights, Ridglea, the TCU area — flat, not falling.
The exceptions are the interesting part. Wedgwood sits seven and a half miles out, well inside Loop 820, and is falling about 2% a year. Walsh sits fourteen miles out at a $599,000 median and is falling faster than that. Neither fits a simple distance rule, and both fit a price-and-distance one.
The full Fort Worth market report has the models behind these numbers, the repeat-sale analysis, and what separates the ZIP codes that are holding from the ones that aren't.
Why ZIP codes and not neighborhood names
Because neighborhood names in this city are unreliable and ZIP codes aren't. The MLS files twenty-six spellings of “Ridglea.” Two subdivisions called Lost Creek sit twenty-three miles apart in different school districts. “Chamberlain Arlington Heights 1st” and “2nd” trade 49% apart per square foot under nearly the same name.
A ZIP code is a boundary somebody can verify. It is not a perfect proxy for a neighborhood — 76131 contains three school districts, and 76133 contains a 1950s ranch market and a 1979 one — but it is a starting point that doesn't quietly blend two markets into an average that describes neither. Where a ZIP hides something important, the page for it says so.
Looking at a specific ZIP code
What I can tell you is what the closed sales in your specific subdivision support, how wide the range around that is and what drives it, and what a property will cost you every month once the assessment settles.
Call or text (682) 207-4310, or send me a note.
All figures come from NTREIS closed sales inside Fort Worth city limits, 19 September 2023 through 18 September 2026, reported in aggregate. ZIP codes with fewer than 120 sales are not shown. Trends are annual coefficients from log-price models controlling for house size, lot size and build year; “significant” means p < 0.05. Circle positions are the median latitude and longitude of each ZIP's sales, not official postal boundaries.