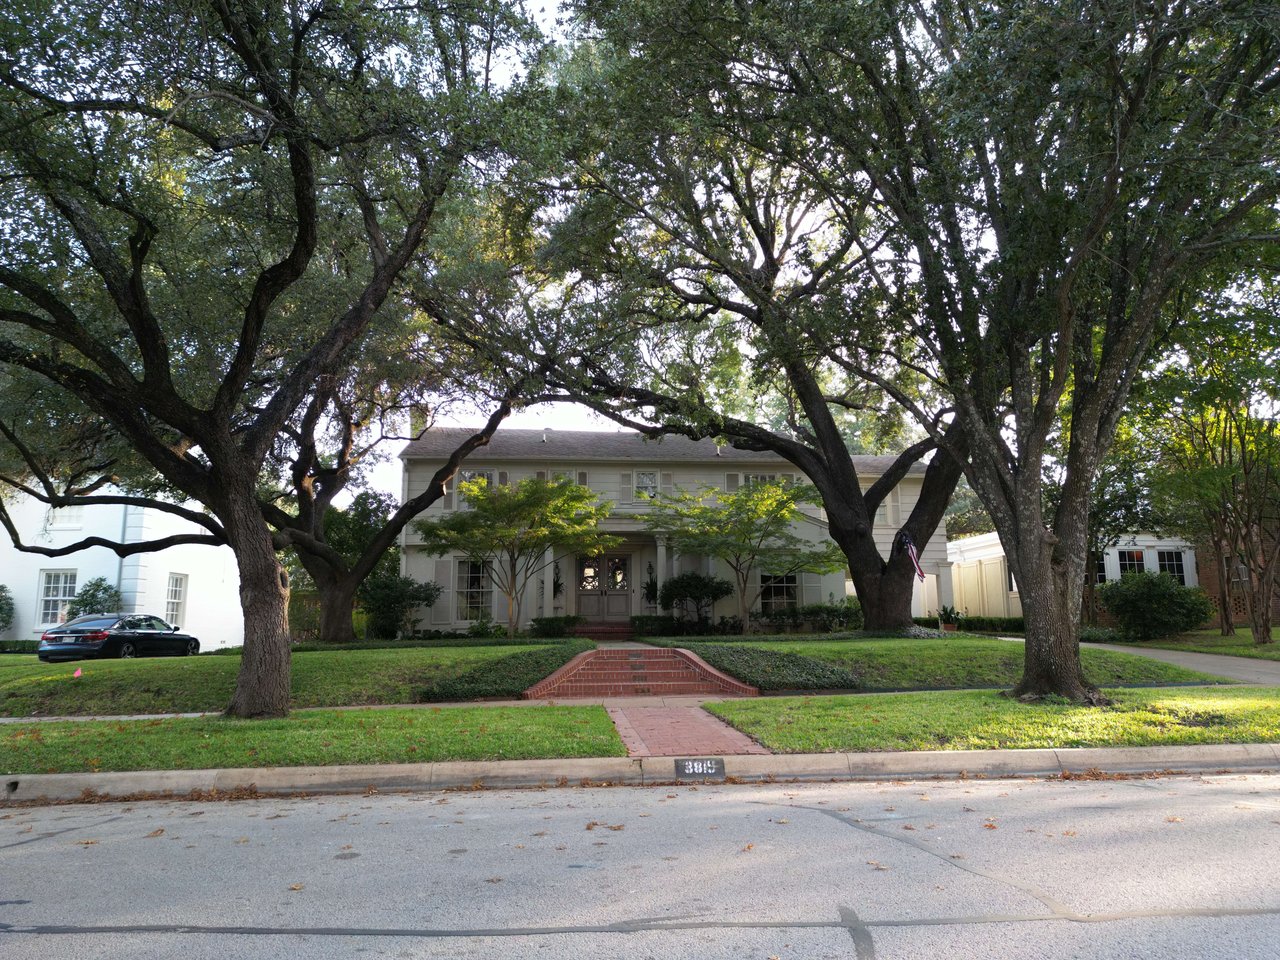
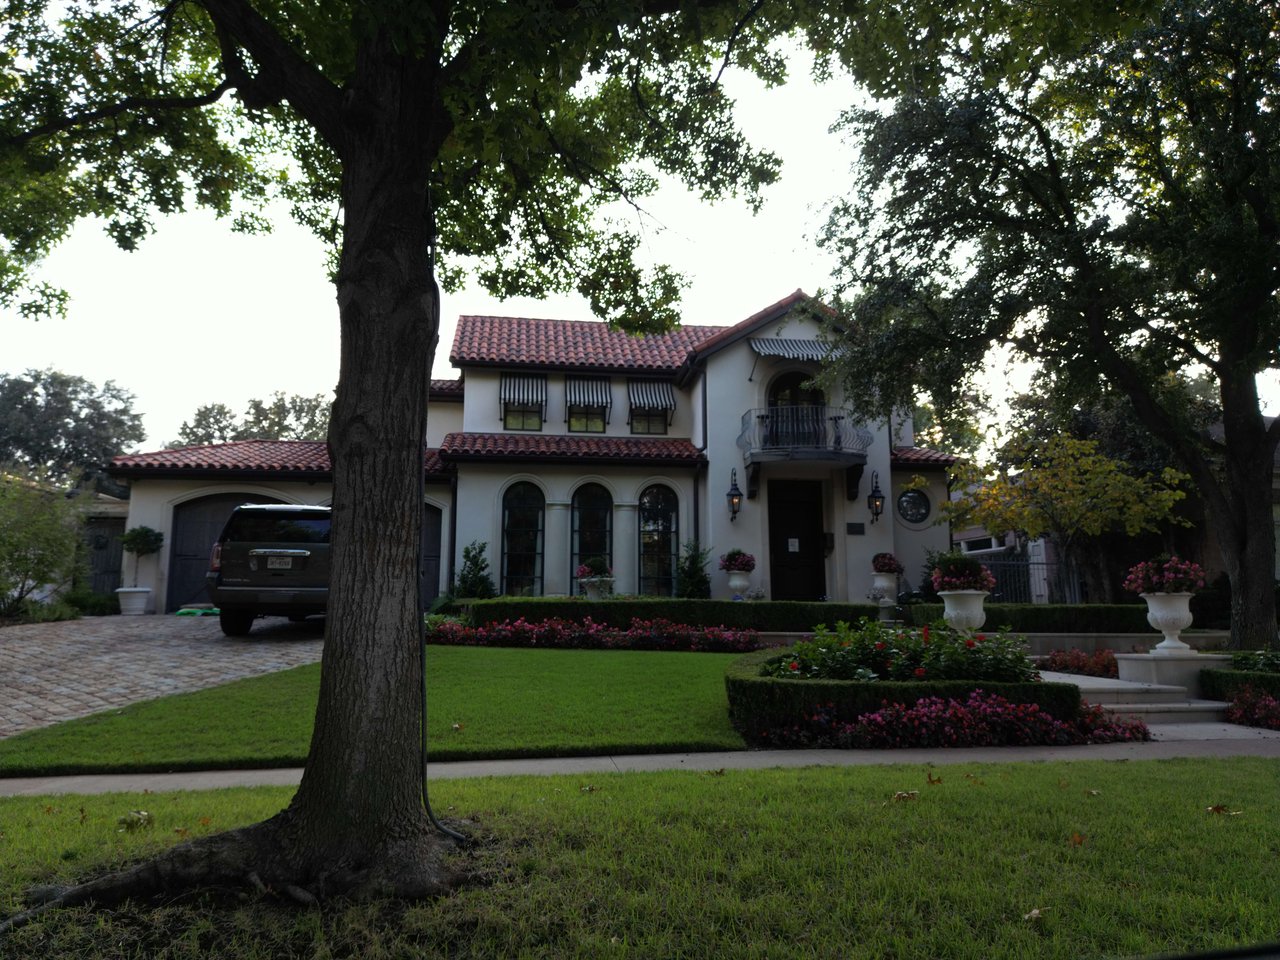
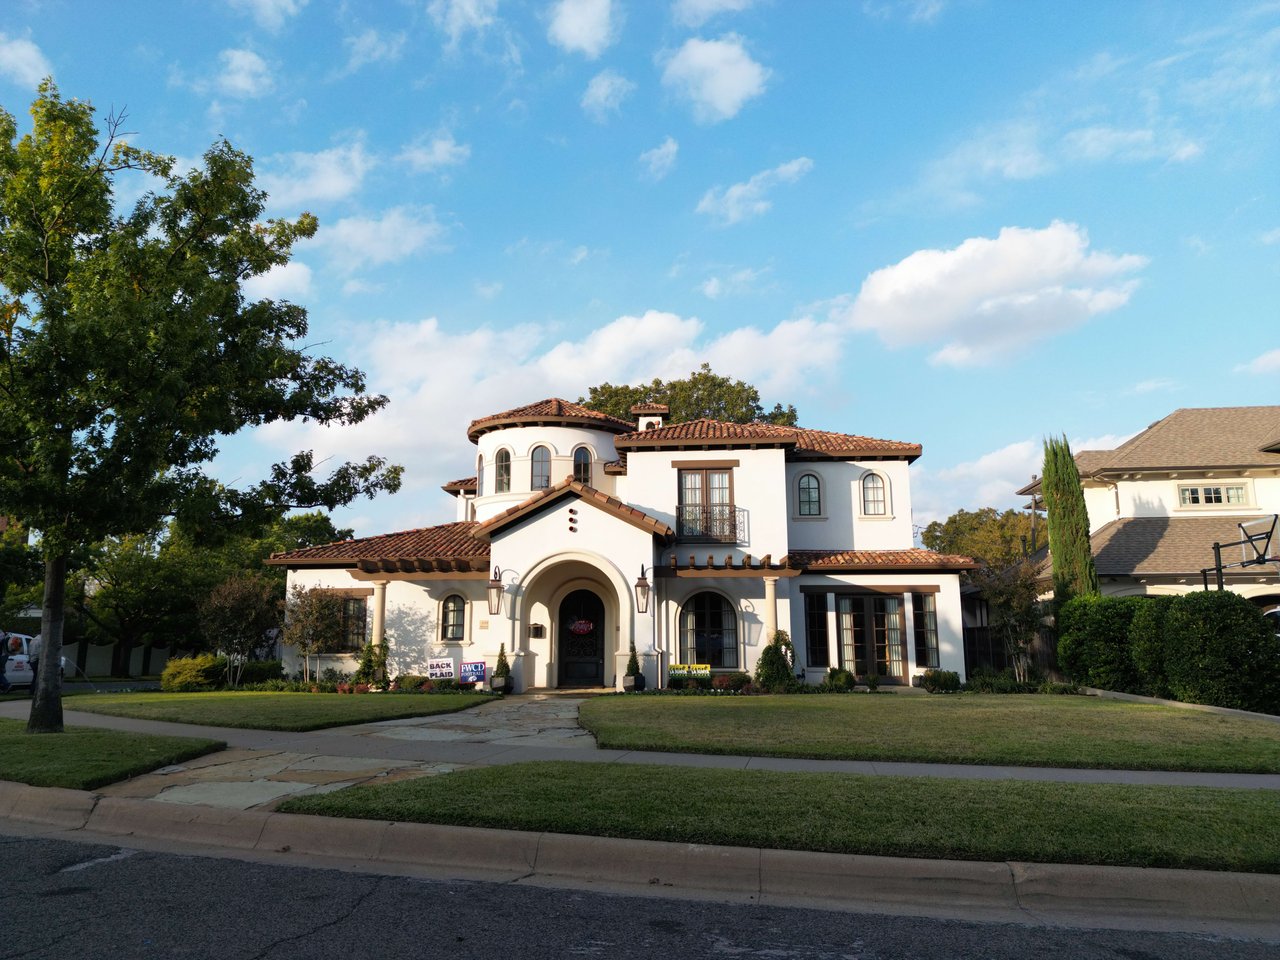
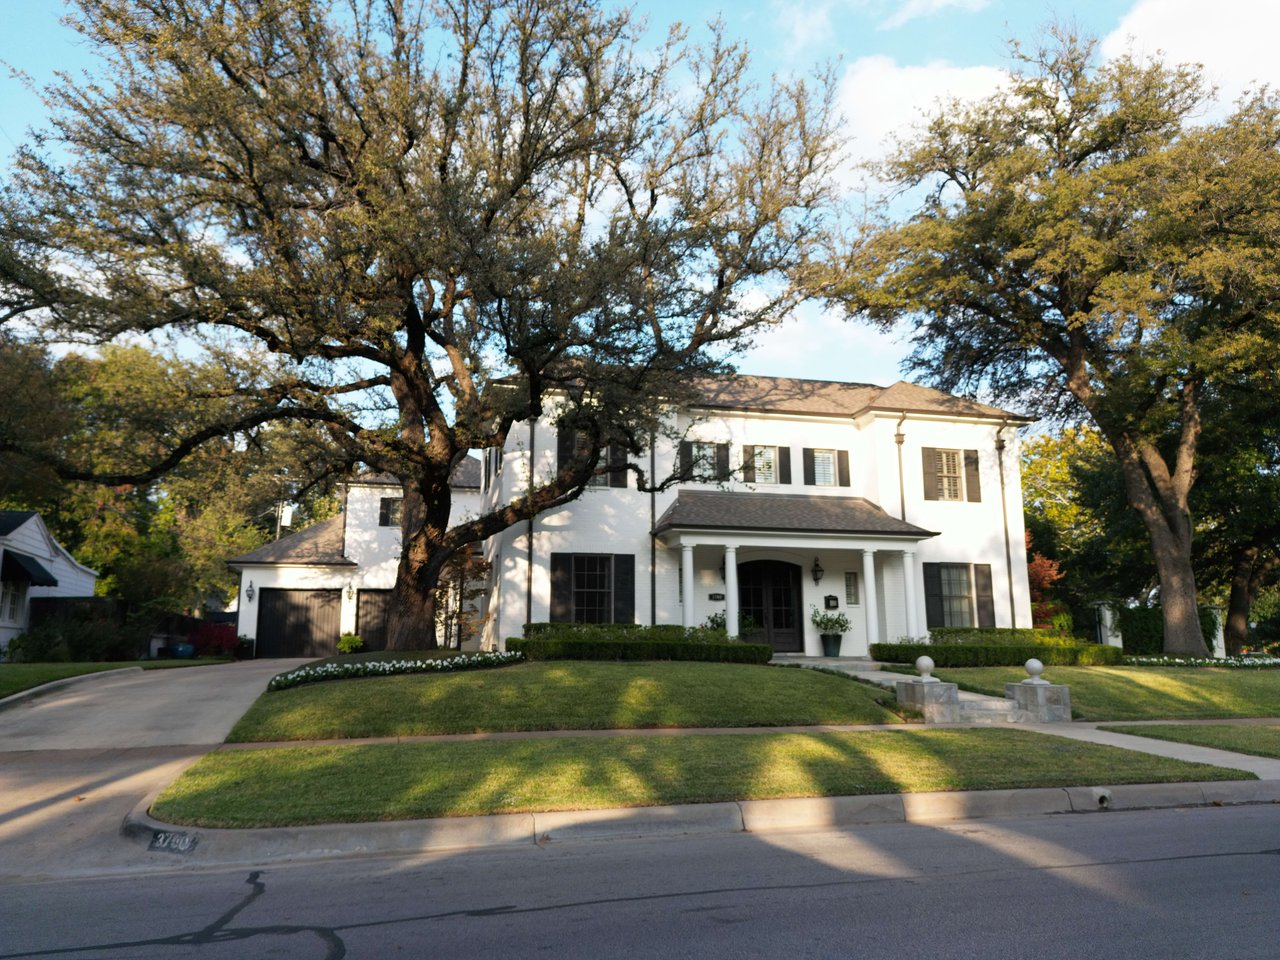
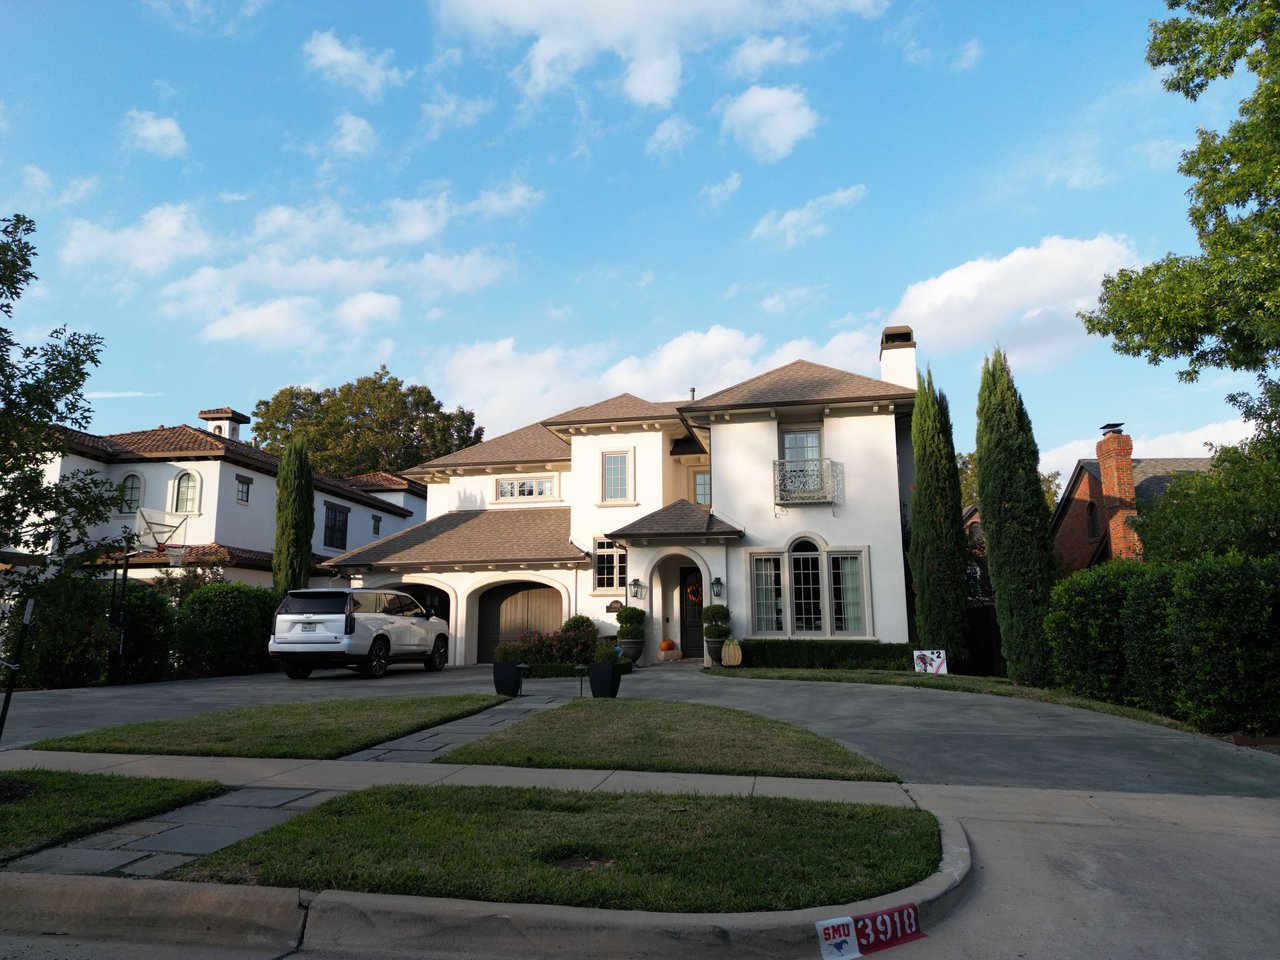
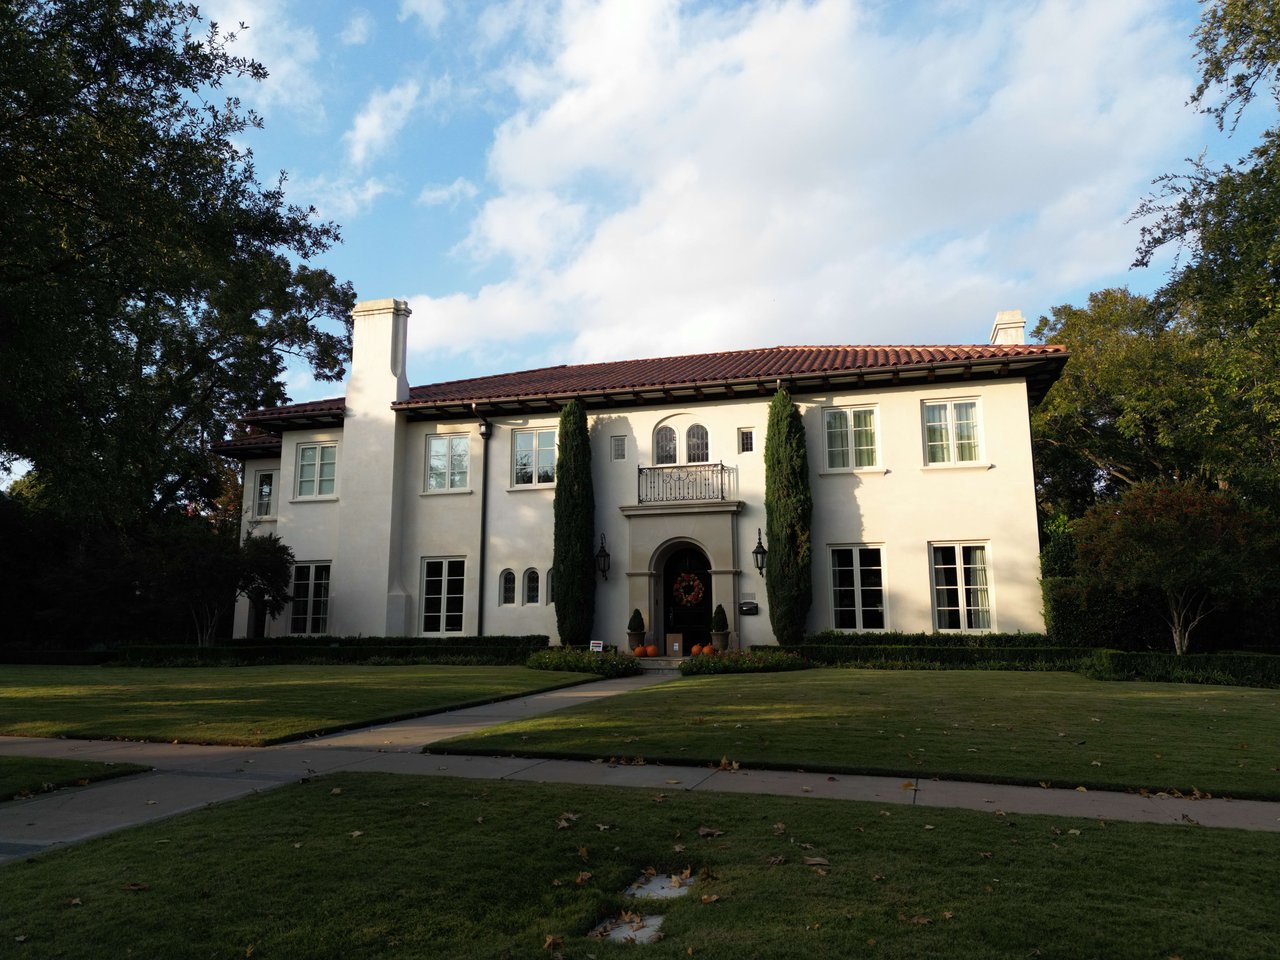
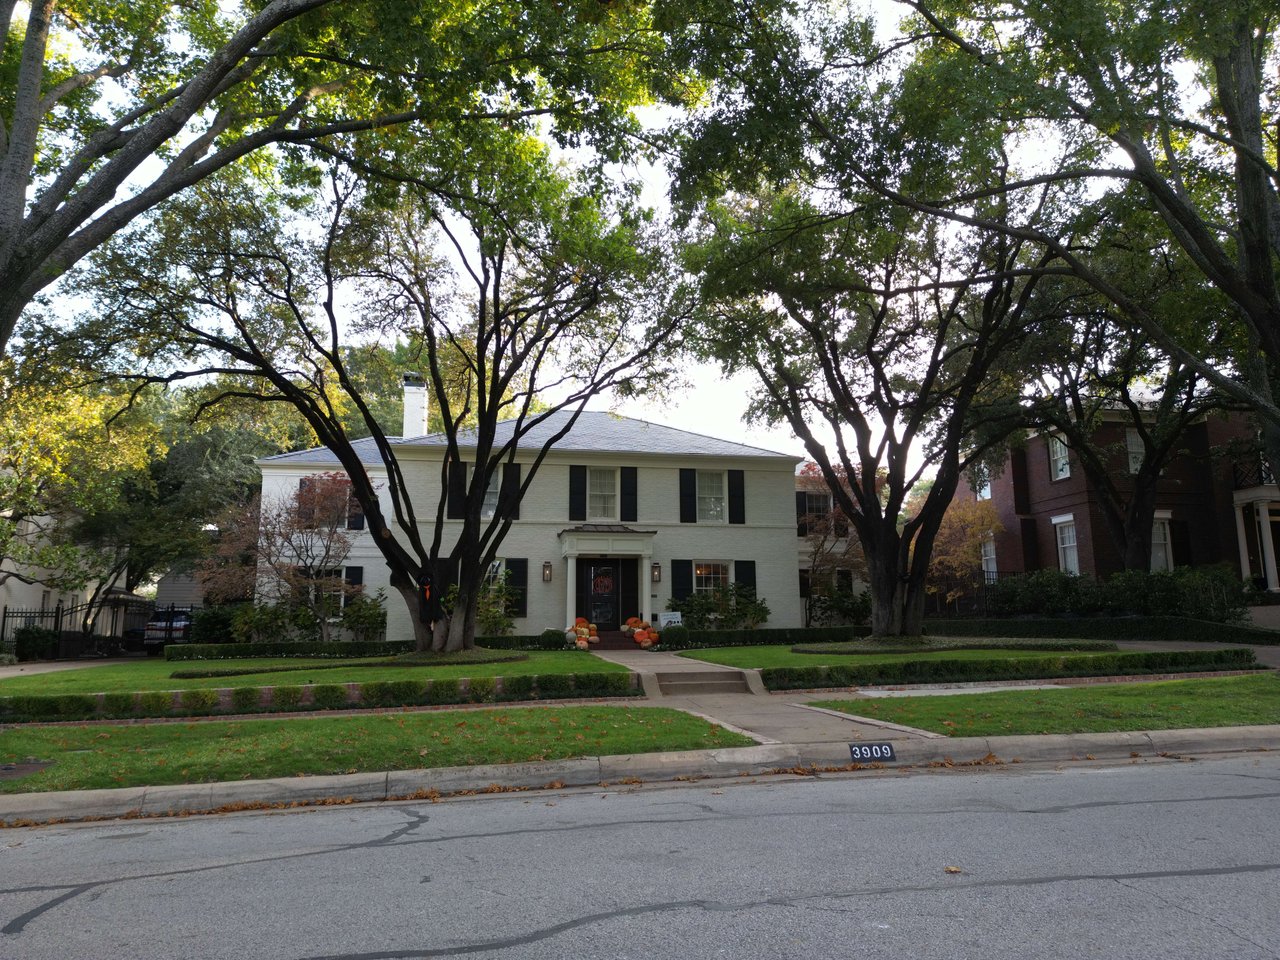
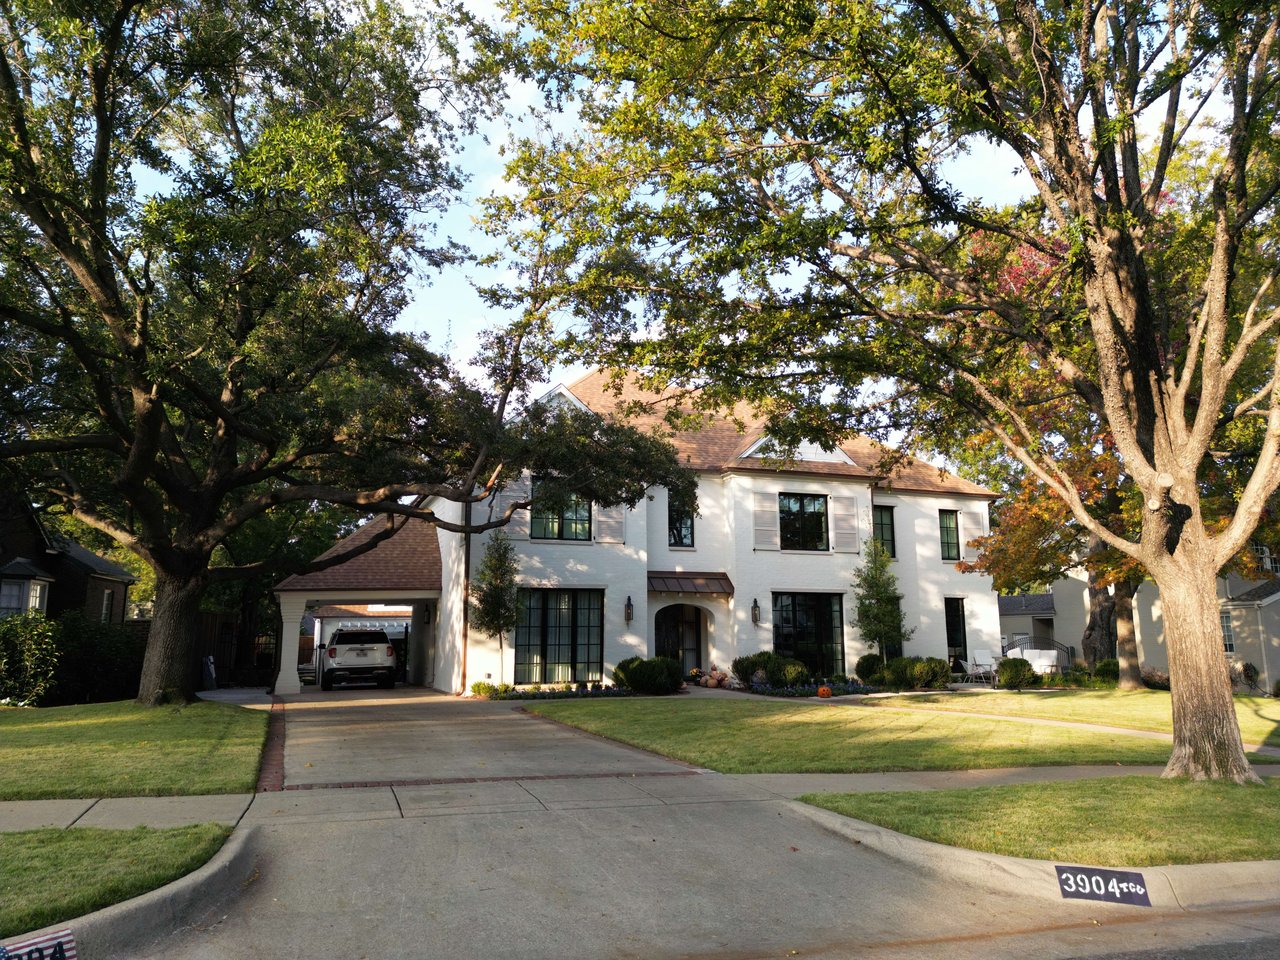
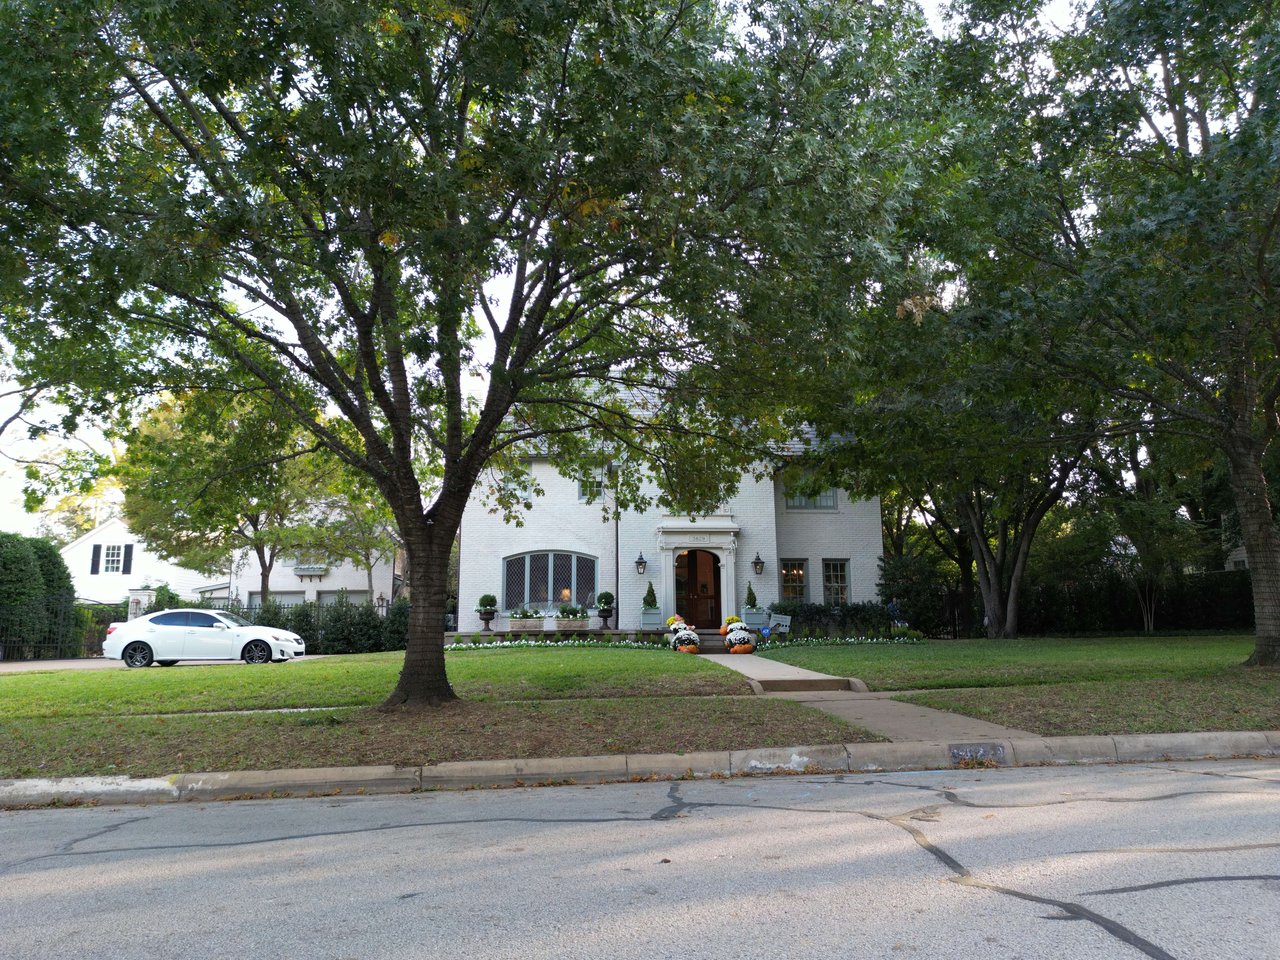
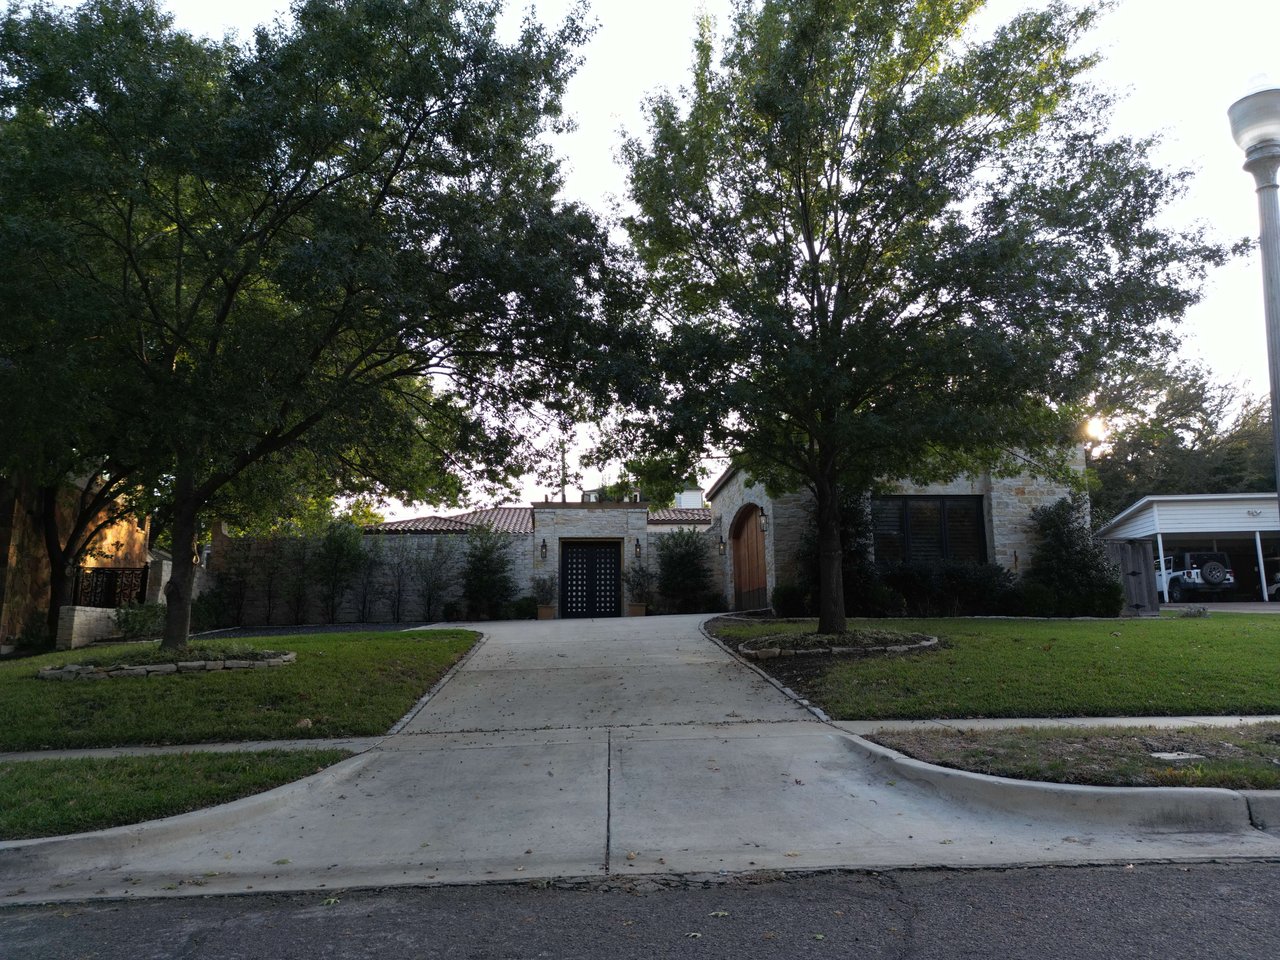
Between Camp Bowie Boulevard and the Trinity, a few minutes west of the Cultural District, sit three of Fort Worth's most established neighborhoods. Monticello and North Hi Mount were platted in the 1920s and 1930s — Tudors, Colonial Revivals and brick cottages on tree-lined streets, walkable to the museums, Camp Bowie and the West 7th corridor. Rivercrest sits west of them around River Crest Country Club, and is something else entirely.
People shop all three together, which is why they share a page. But what's actually happening here isn't a story about three neighborhoods. It's a story about a hundred-year-old area being rebuilt house by house.
I'm a Fort Worth broker and a Certified Residential Appraiser. Here's what six years of sales show.
More than a third of what sells here was built after 2000
Across the area I pulled 431 listings and 304 closed sales over the six years ending September 2026. Setting Rivercrest aside for a moment, here is the finding that matters most:
- Historic homes (built before 2000): 186 sales, median $545,762 on 1,788 square feet — about $301 per foot
- New homes (2000 and later): 110 sales, median $812,500 on 3,134 square feet — about $270 per foot
Thirty-seven percent of everything that sold in these 1920s neighborhoods is newer than 2000. These are not preserved historic districts. They're being replaced, lot by lot, and it's concentrated: in the Country Club Heights and Bailey sections, 57 of 102 sales were post-2000 construction. In Monticello proper it's only 18 of 98.
So the practical question here isn't which neighborhood a home is in. It's which era, and what's happening on the block around it. A restored 1935 cottage next door to a 2019 rebuild is a different proposition from the same cottage on a street that hasn't turned over.
Notice too that the new homes cost more in total but less per foot — and sit on smaller lots, a median of 5,924 square feet against 6,752 for the historic stock. You're buying square footage, not land.
What the area sells for
Across all 304 closed sales: median $630,000 on 2,226 square feet, about $292 per foot, in 24 days at 96% of original list. Closed prices ran from $180,000 to $4,500,000.
By sub-area:
- Monticello — 98 sales, median $625,000, $298 per foot, 21 days, 97% of list
- North Hi Mount — 93 sales, median $660,000 on the largest homes in the area at 2,542 square feet, $296 per foot, 22 days, 97% of list, and the fewest listings coming off the market here at 17%
- Country Club Heights, Bailey and Trinity Heights — 101 sales, median $610,000, $274 per foot, but 36 days and 95% of list. The rebuild zone, and measurably slower than the streets that haven't turned over.
Values climbed through 2025 — the per-foot median went from $260 in 2021 to $312 in 2025 — and have eased slightly in 2026 to $306 while selling faster, a median of 16 days.
Rivercrest is a different market
West of the others, around River Crest Country Club, Rivercrest trades on a different scale and behaves nothing like its neighbors.
Over six years it produced 21 listings and 8 sales — roughly one and a third a year. Those sales ran from $1,085,000 to $4,500,000, at a median of about $457 per foot on homes near 4,700 square feet and lots around 13,000.
Three numbers tell you how it works. Median time on market: 91 days, against 22 next door. Sale price as a share of original list: 89%, against 97%. And ten of the twenty-one listings came off the market without selling. Those cluster at the top — asking prices of $6,950,000, $4,850,000, $4,200,000 and $3,950,000 all came off without trading.
One more data point, and it's the cleanest kind. A single Rivercrest property sold twice in the period — in 2021 and again in 2023, same house, same square footage. It gained 2.6% in twenty-six months. A repeat sale of an identical property is the most reliable measure of appreciation that exists, and at the top of this market it says values have been close to flat.
If you own in Rivercrest, that's the page in one paragraph: there may be one genuinely comparable sale for your house in five years, buyers have been thin above about $2.5 million, and the listings above that have come off the market rather than been negotiated down. Owners at this level are rarely under pressure — when the number doesn't come, staying is a perfectly good option, and several have taken it.
(The newer Rivercrest Bluffs and River District across the Trinity share the Rivercrest name in the MLS and are a different school district entirely. Worth knowing if you're comparing the two.)
What the withdrawn listings were asking
Across the area excluding Rivercrest, 102 listings were cancelled, expired or withdrawn over six years. They sat a median of 82 days before coming off, and they were asking a median of $310 per foot against the $289 that sales actually cleared — and a median list price of $762,500 against a $625,000 median close.
Roughly seven percent apart on a per-foot basis, and higher in total price. That's where the two groups started; it isn't proof of why one traded and the other didn't. In a hundred-year-old area where owners tend to have long tenure and real equity, a listing coming off is often just an owner deciding the number wasn't there and staying put.
What the market is actually doing
Worth setting the context, because this is one of the few areas where I can demonstrate a rising market rather than assert one. Across 304 closed sales spanning five years — the deepest record of any neighborhood I track — price per square foot has climbed 4.0% a year once you control for house size, at p < 0.001. With that much data behind it, this is about as solid as residential price evidence gets.
It's the useful counterweight to everything above about listings coming off the market. Values rose while more listings withdrew, which is what happens when owners have equity and no deadline and decline to cut. For context, across the eighteen Fort Worth neighborhoods I track, not one shows a statistically significant decline — and this area is one of only four that can show a confirmed rise.
Schools, taxes and the practical stuff
Every listing across all three neighborhoods is Fort Worth ISD — no district line runs through this area, which makes it unusual among the neighborhoods I cover. Confirm the specific campus for an address with the district.
Taxes follow the ordinary Fort Worth pattern: a combined rate near 2.19%, with no PID and no MUD. Across closed sales, annual taxes ran about 1.9% of purchase price. Only about 13% of homes here have a pool, which is low — on these lot sizes, one is worth more than it would be further west.
What I look at in a house here
- Era, and the block around it. Historic or rebuild, and how much of the street has already turned over. This drives value more than which neighborhood name applies.
- What a renovation actually touched. These are ninety-year-old houses. New finishes over original wiring, galvanized supply and an unexamined foundation is a different asset from one where the expensive invisible work was done. Ask for permits, not photographs.
- Additions and their approvals. Common here, and not all were permitted. An appraiser treats unpermitted square footage differently than a listing does.
- The lot. Land tracks value more closely than house size does in the historic stock, and the newer homes sit on smaller ground than the old ones.
- Attached or detached. Thirty-three of the thirty-five townhomes sold here were built after 2000, at $263 a foot against $301 for detached homes. They're interleaved, and they're not comparable.
If you're selling here
Homes in Monticello and North Hi Mount that are positioned near the market go in about three weeks at 97% of asking. That is still a quick, strong market for a correctly positioned house. The listings that come off instead sit around three months first, and there isn't much in between.
What works: comparables from your actual era and product type — not a blend of 1935 cottages and 2019 rebuilds — an honest read on whether your block reads as historic or transitional, and documentation of the work that's been done.
In Rivercrest it's a different exercise entirely. With one or two sales a year, the price has to be reasoned from first principles rather than averaged, and the practical choice is between a number that trades this year and a number worth waiting for.
Buying or selling in Rivercrest, Monticello or North Hi Mount
Almost every question in this area is a valuation question: what a restoration was worth, whether a rebuild next door helps or hurts you, whether that comparable sale is actually comparable, and how much of the price is the house against the block it sits on. Holding a Texas broker's license alongside a Certified Residential Appraiser certification is why I can answer those from evidence.
Call or text (682) 207-4310, or send me a note.
Sales figures are medians from NTREIS listings and closed sales for the six years ending September 2026, reported in aggregate. Tax rates, school assignments and market conditions change — confirm current figures for a specific property before relying on them.