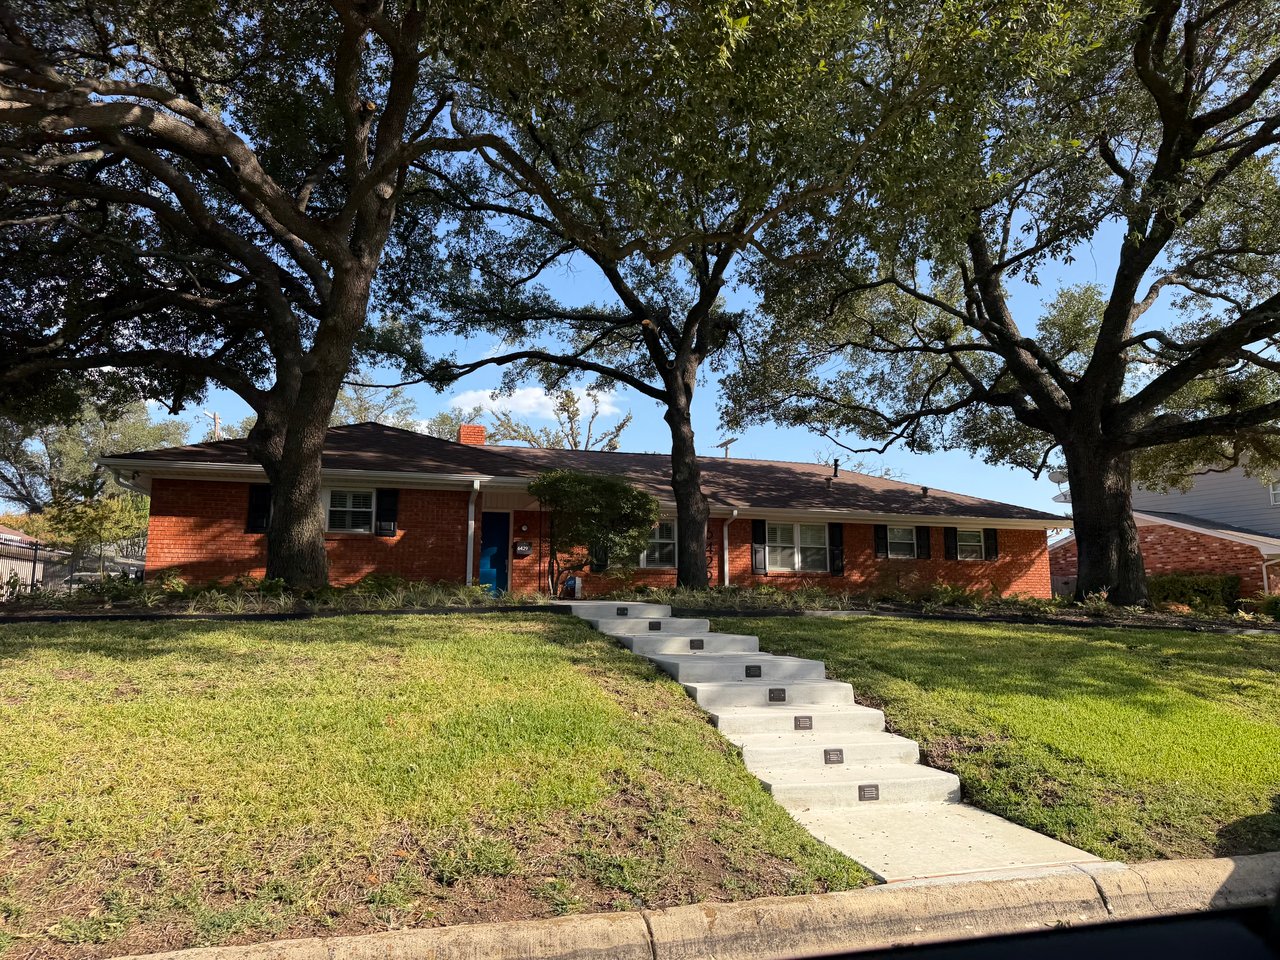
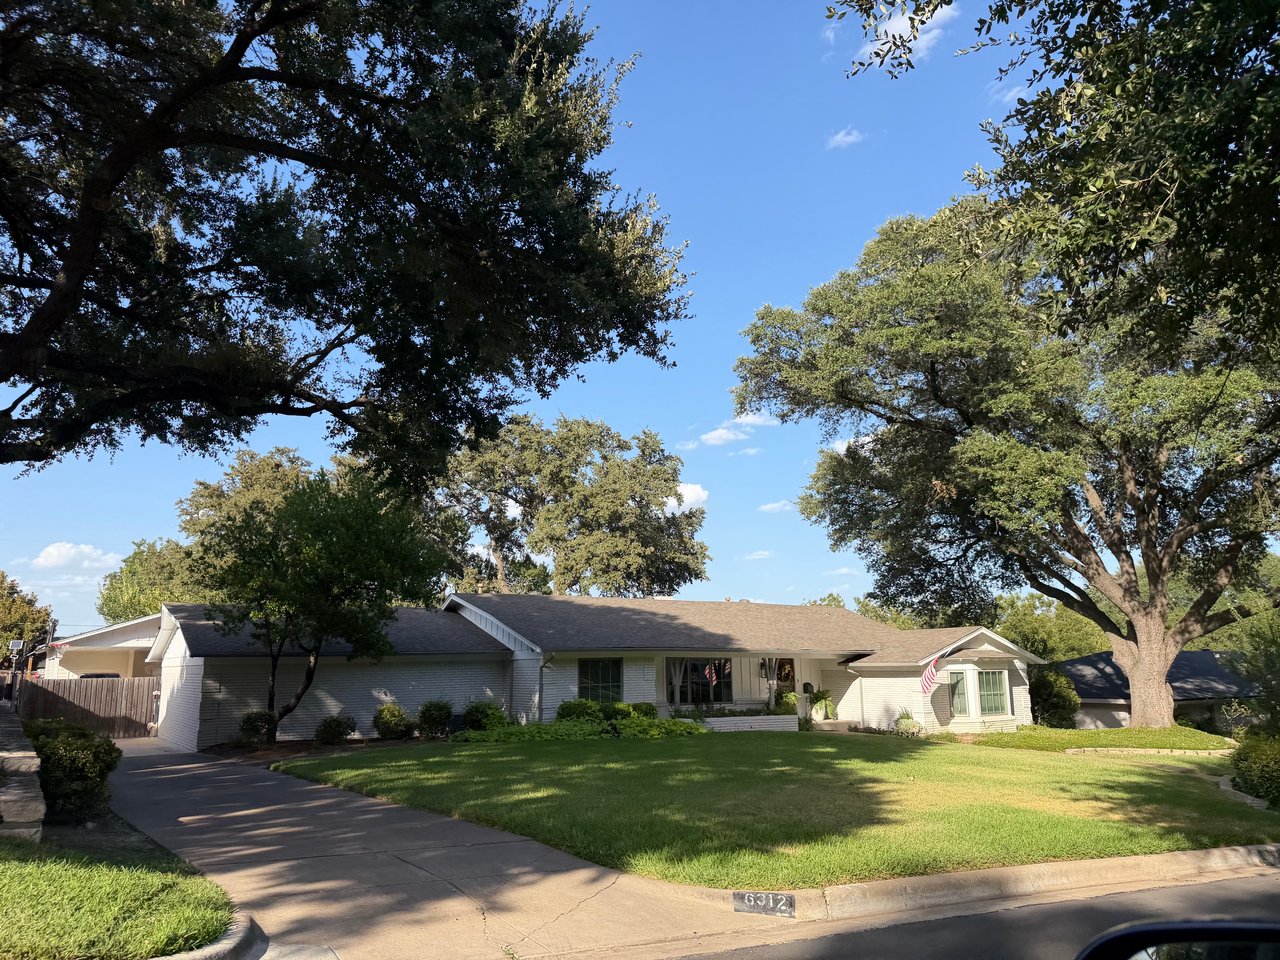
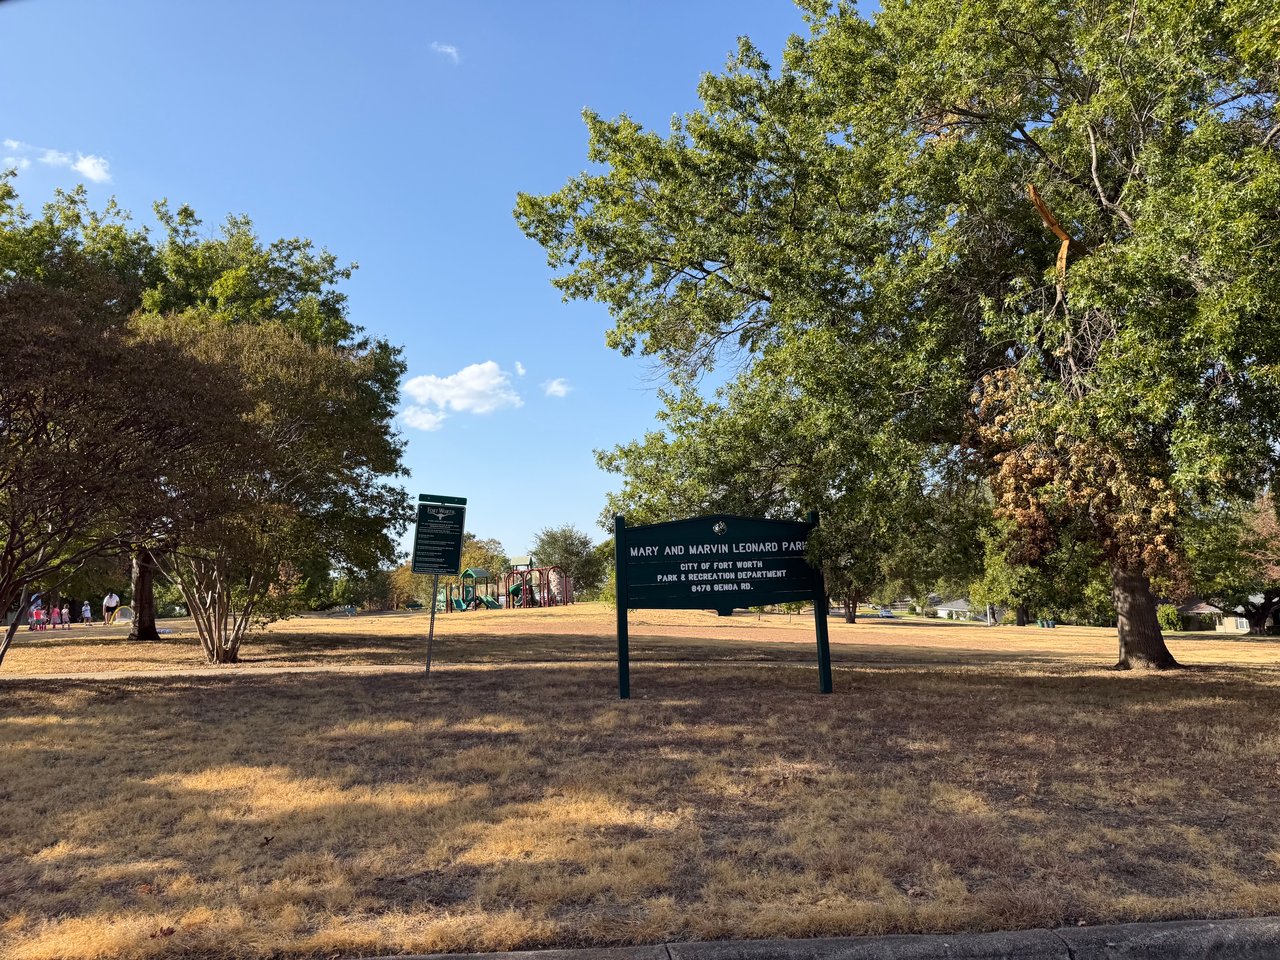
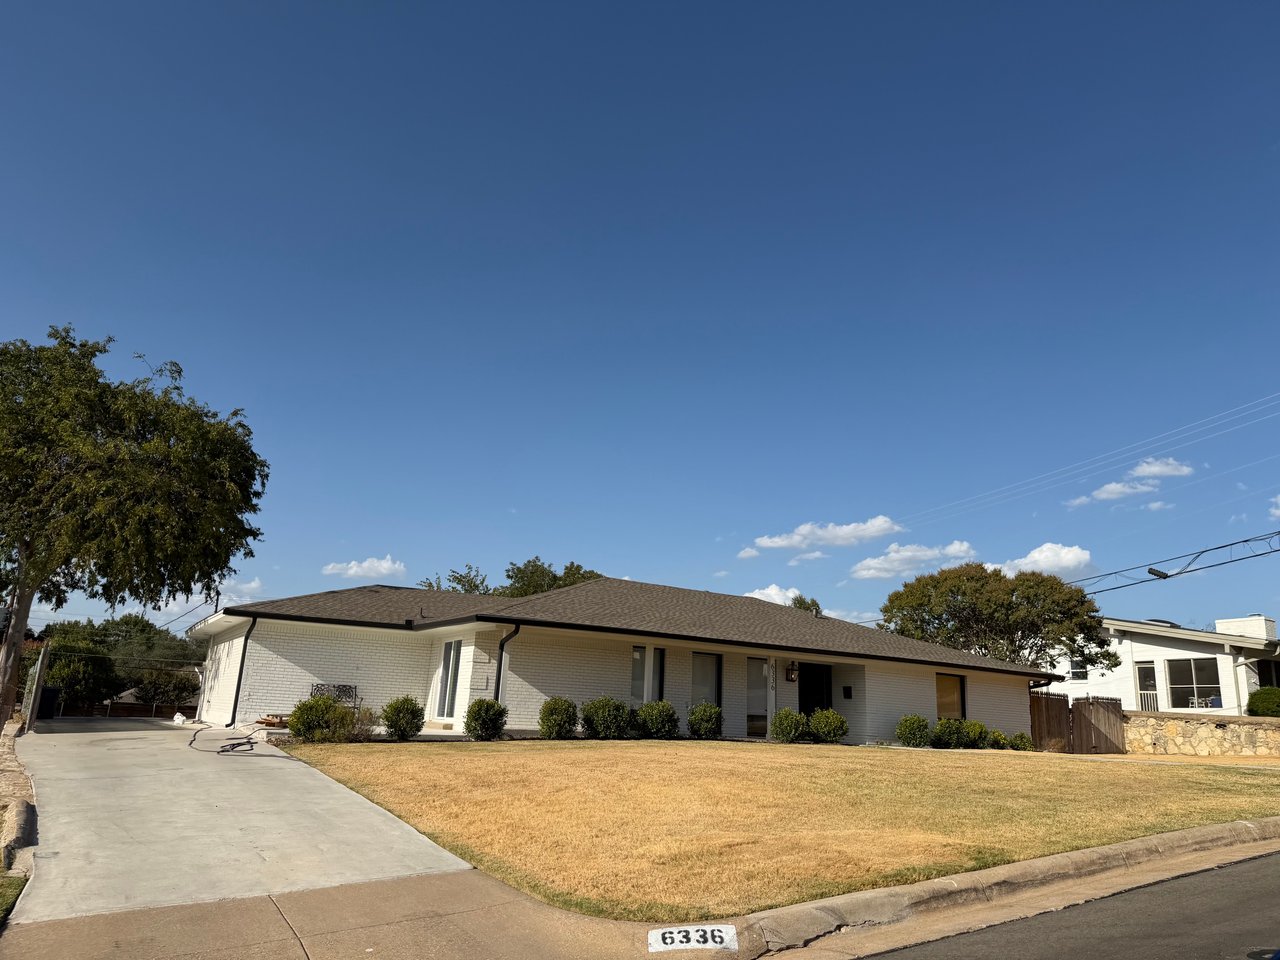
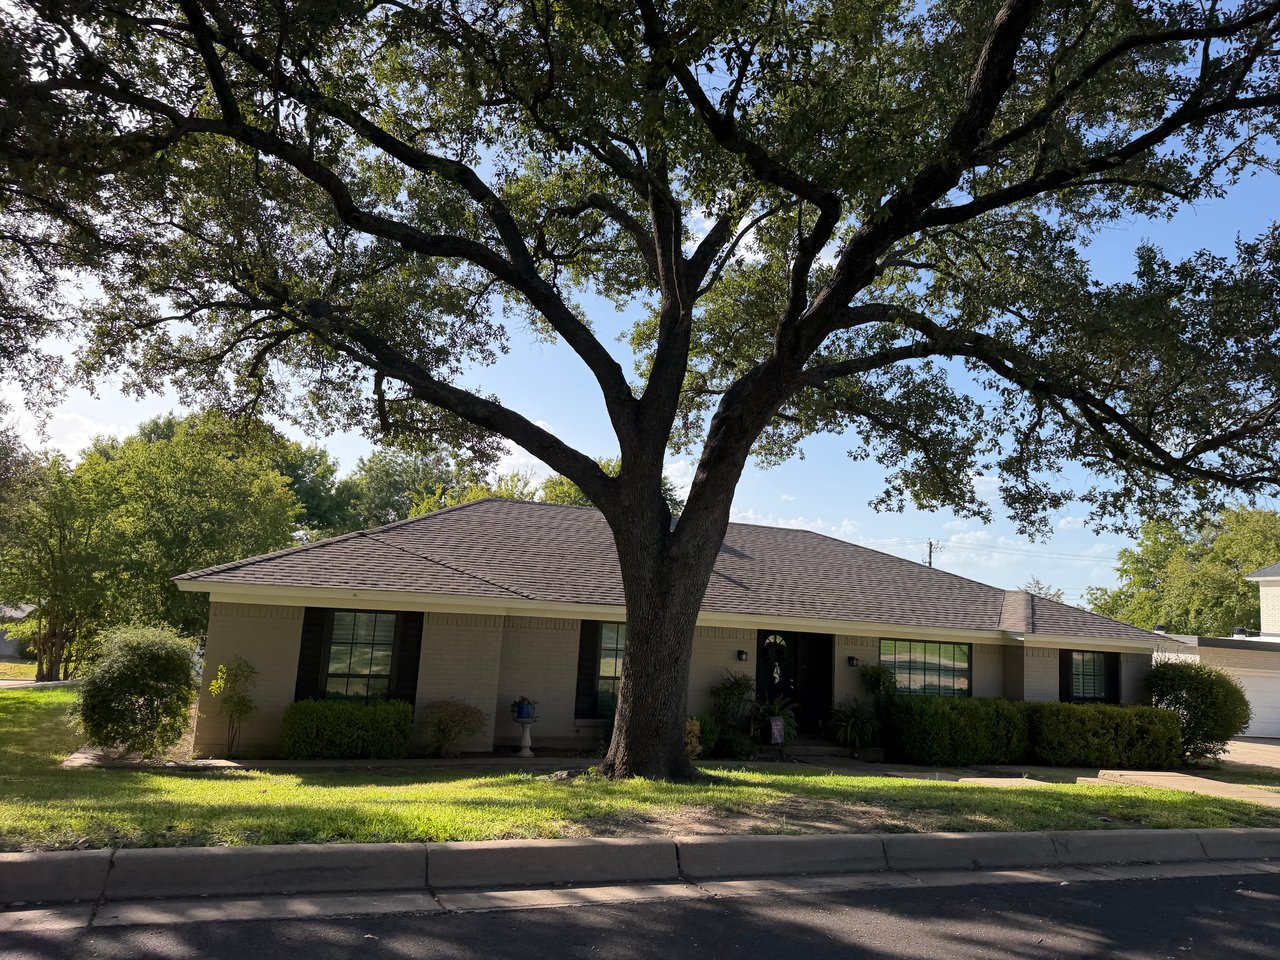
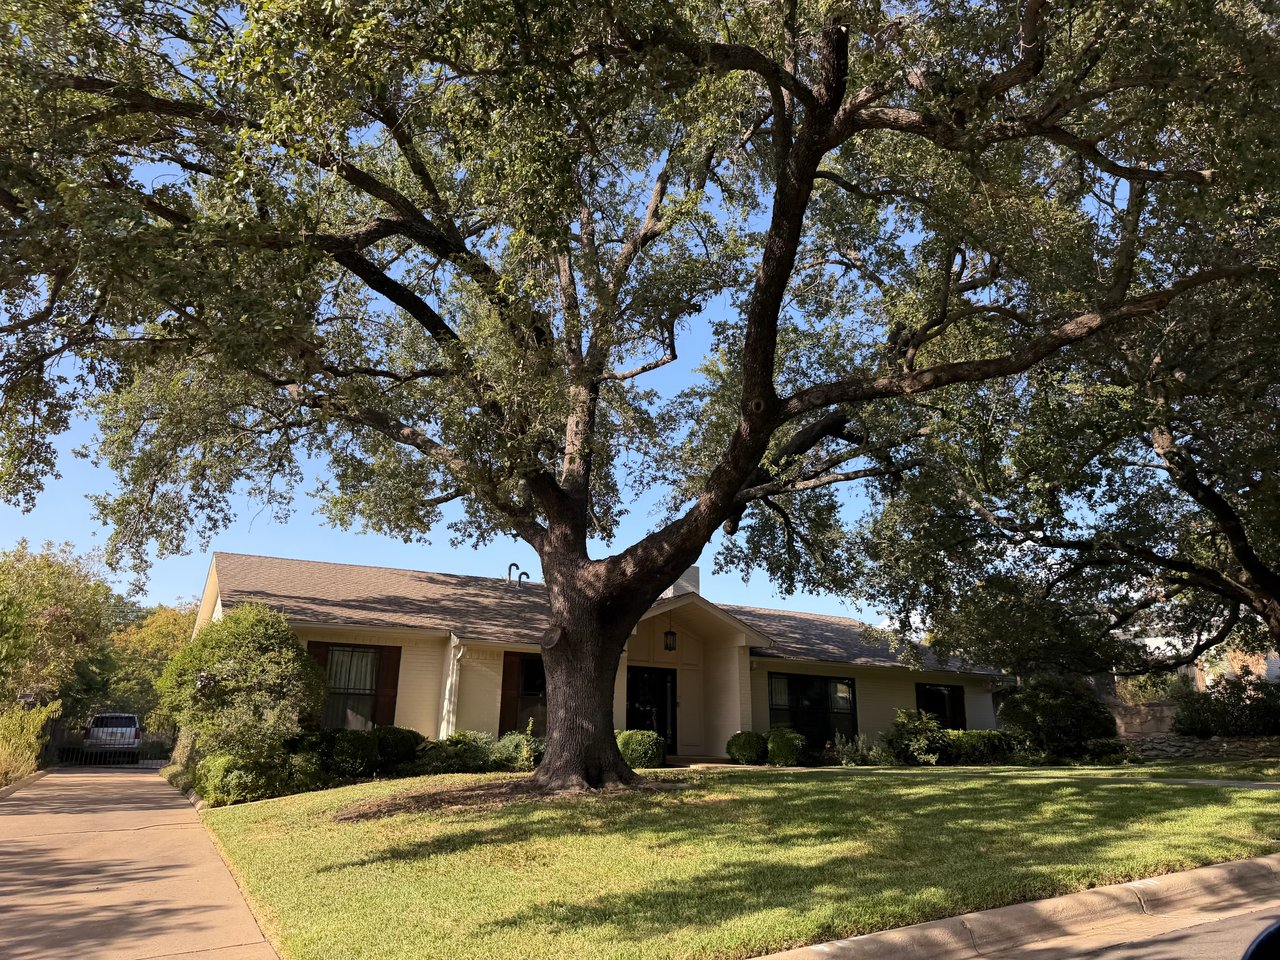
Ridgmar sits north of I-30 on Fort Worth's west side, about six miles from downtown, bounded by Highway 183 to the west and Roaring Springs Road to the east, with Westover Hills immediately next door.
It exists because J. Marvin Leonard bought roughly 1,200 acres from the Amon G. Carter Foundation in 1956, built Shady Oaks Country Club on the north end, and began selling homesites in 1957. What makes the neighborhood still read the way it does, seventy years on, is that he wrote unusually strict deed restrictions into it — building setbacks of up to 40 feet where 25 was the norm, with rear-entry garages and minimum size requirements on some streets. That's why Ridgmar's streetscape feels generous in a way that newer neighborhoods at the same price point don't.
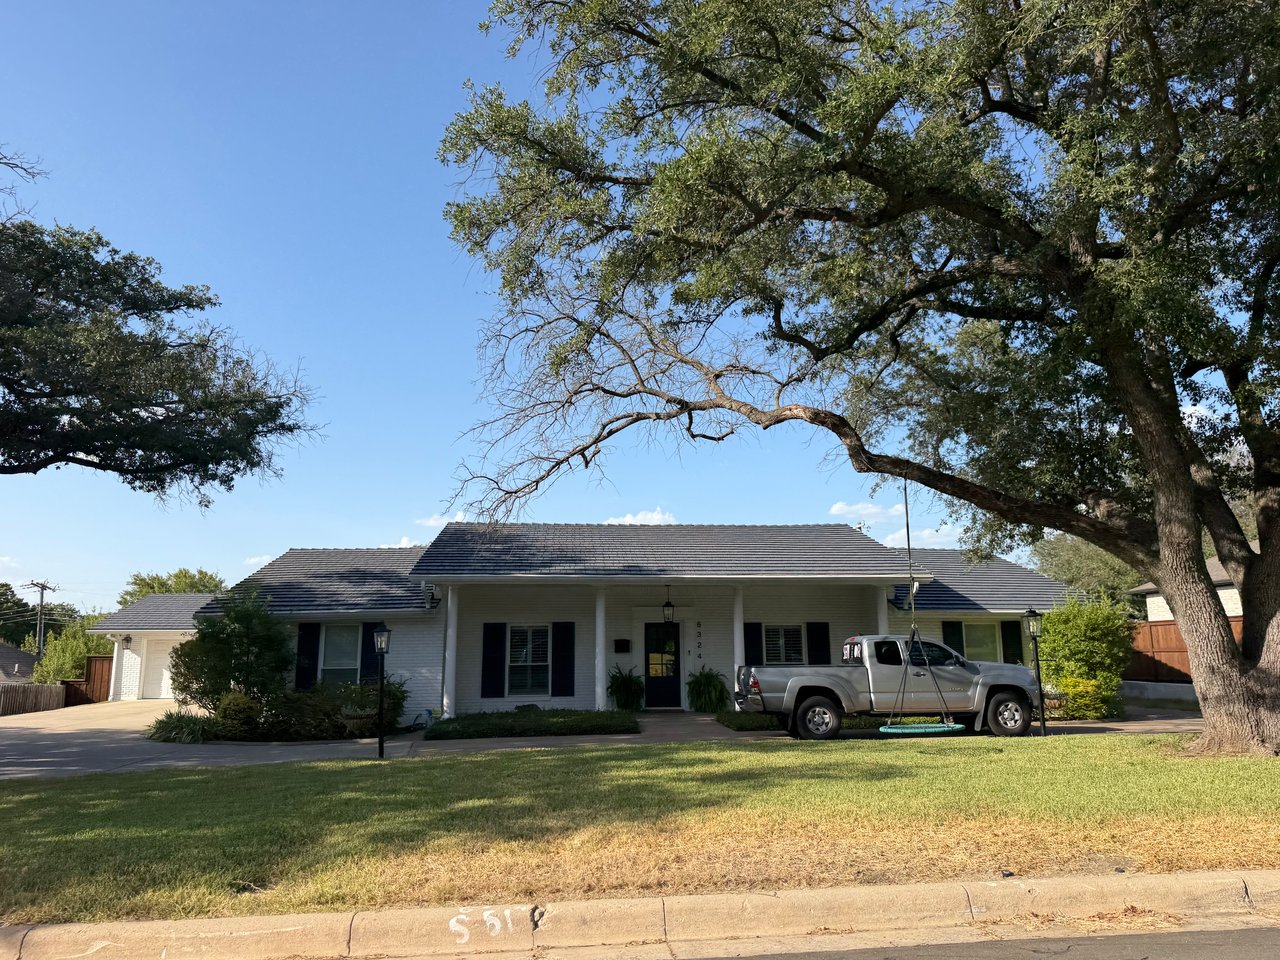
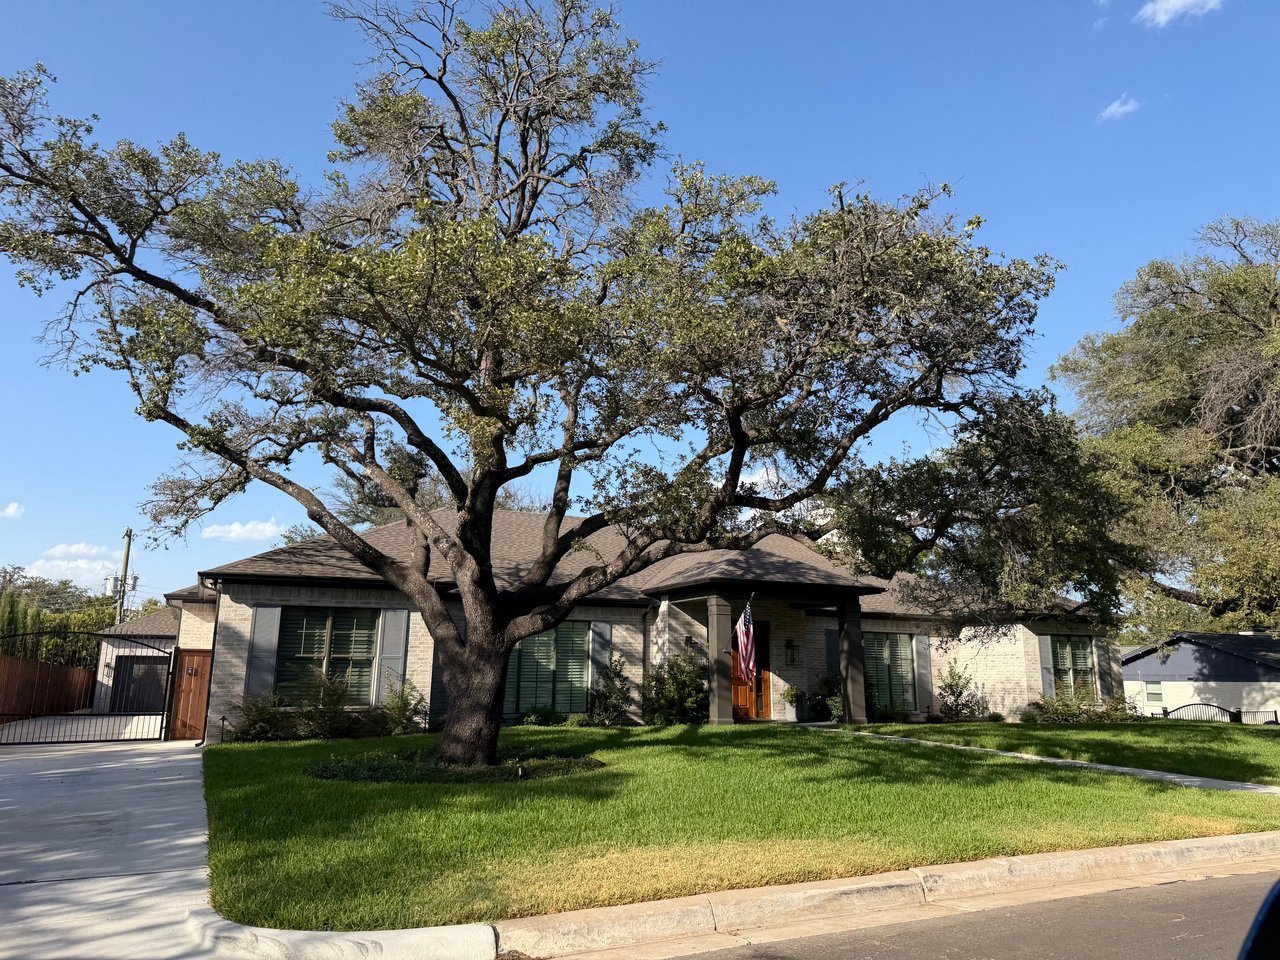
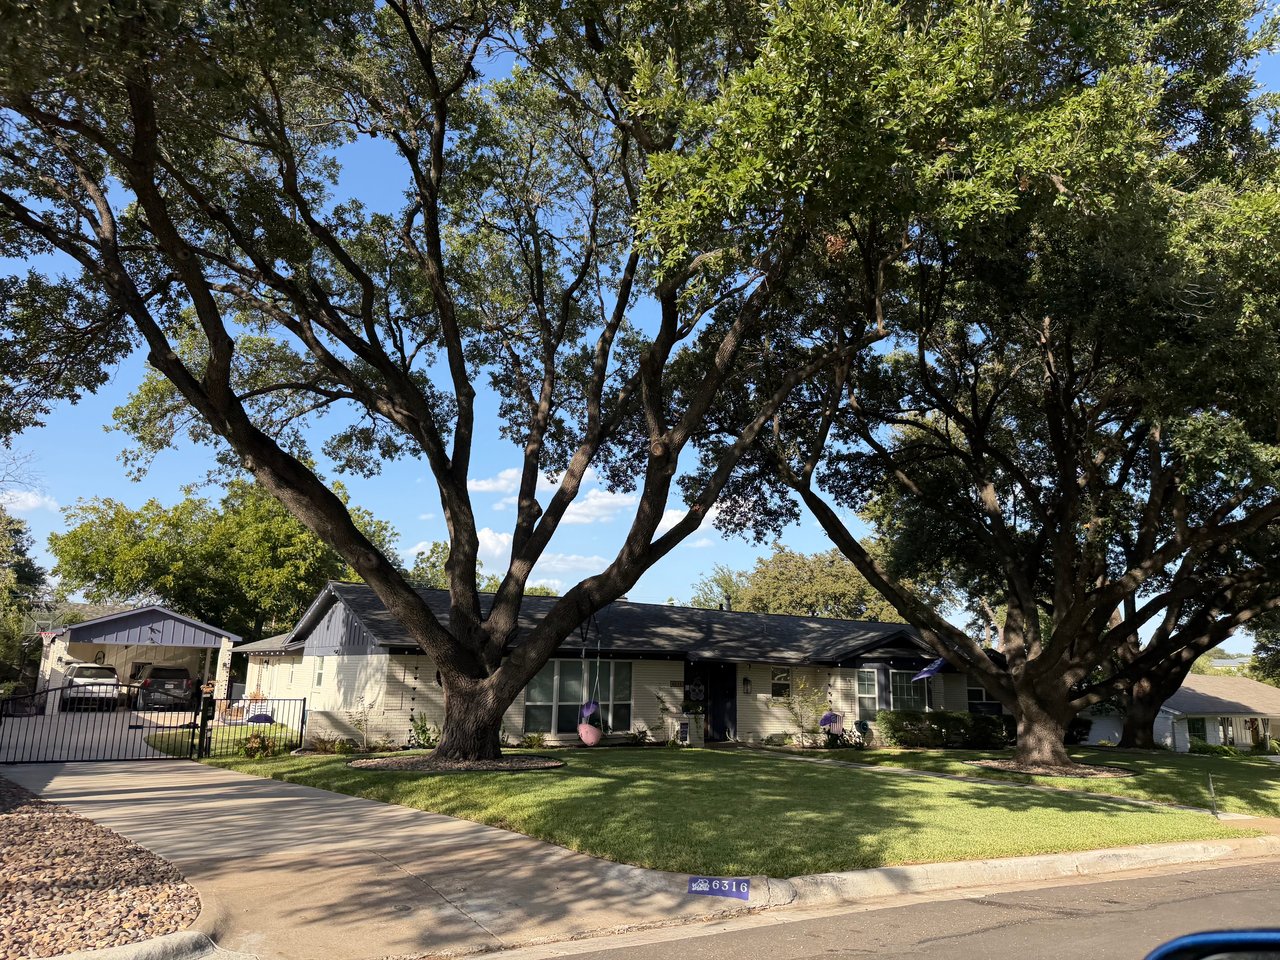
The homes are mostly early-1960s: ranch, split-level and traditional, on lots around 13,000 square feet. Median closing price is about $525,000.
You'll occasionally hear Ridgmar called “Leftover Hills,” because it sits next to Westover Hills and isn't Westover Hills. It's a decent joke and a bad way to think about a purchase. Westover Hills is a separate incorporated town and one of the most expensive addresses in Texas; Ridgmar is a 1960s Fort Worth neighborhood with strong deed restrictions at a quarter of the price. They were never the same product. What being next door actually buys you is the streetscape, the tree cover and the location — and what it costs you is being permanently compared to a neighbor you were never competing with.
I'm a Fort Worth broker and a Certified Residential Appraiser. Two things about this neighborhood are worth your time — one everybody's asking about, and one nobody is.
The mall is becoming a warehouse district. Here's what the data says so far.
Ridgmar Mall opened in 1976 and is plainly at the end of its life. Neiman Marcus left for Clearfork in 2017, JCPenney's store closes November 1, 2026, and most of the rest of the building has already emptied out. Anyone who has driven past it lately knows what it looks like.
The 75-acre site at I-30 and Highway 183 has been bought by Ramrock Real Estate, with Lincoln Property Co. and KBC Advisors, and is planned as “Ridgmar 30 Logistics Crossing” — roughly 931,000 square feet across six warehouses. Demolition could begin within 12 to 18 months, with construction tentatively around 2028.
The obvious question is what that does to home values here. I went looking for it in the sales, and I'll give you the honest answer rather than the dramatic one.
It hasn't shown up yet. I measured every closed sale's distance from the site and tested it against price per square foot. The correlation is 0.09, with a p-value of 0.39 — statistically indistinguishable from no relationship. Homes in the quartile nearest the mall cleared $225 a foot; the quartile farthest cleared $235, and most of that gap disappears once you account for the farther homes being larger, on larger lots.
Two things worth knowing alongside that.
No Ridgmar home actually abuts the site. The closest sales I found are roughly four-tenths of a mile from it, with commercial frontage in between; the farthest are about a mile and a quarter. That buffer is real and it's part of why the effect is muted.
And a failing mall was already a drag. The relevant comparison isn't warehouses versus a healthy shopping center — it's warehouses versus a mostly empty 1.2 million square foot building. Whether the change is negative depends on how the truck routing and the traffic pattern land, and that isn't decided yet.
What I'd tell an owner here: this is a thing to watch, not a thing to panic about, and right now you have a clean baseline. If you want to know what your specific street looks like against the sales before demolition starts, that's exactly the kind of question I can answer with evidence.
Ridgmar is a house market, not a land market — unlike its neighbors
This is the part nobody's talking about, and it changes how you should price here.
In Ridglea, just south across I-30, price per square foot climbs with lot size — land is the dominant value driver, and a modest house on a big lot outperforms dramatically. In Ridgmar, that effect is absent. The correlation between lot size and price per foot here is 0.05. None.
Instead Ridgmar behaves the ordinary way: price per foot declines as houses get larger (correlation −0.28), because a kitchen, a roof and a foundation don't scale with square footage.
The reason is Leonard's deed restrictions. He standardized this neighborhood — setbacks, lot sizes, siting — so the lots here cluster tightly around 13,000 square feet instead of ranging six-fold the way Ridglea's do. When the land is uniform, it stops explaining price differences, and the house takes over.
Practically: in Ridgmar, the condition and quality of the house is your value story. Not the lot. That's the opposite of the advice I'd give someone four minutes south, and it's why a per-foot number borrowed from a neighboring subdivision will mislead you.
What sells here
Over the three years ending September 2026, the Ridgmar homes covered here produced 156 listings and 98 closed sales:
- Median close $525,250 on 2,360 square feet — about $228 per foot
- Median lot 13,024 square feet, median year built 1963
- Median 32 days on market at 96.6% of original list
- Range: $275,000 to $1,280,000
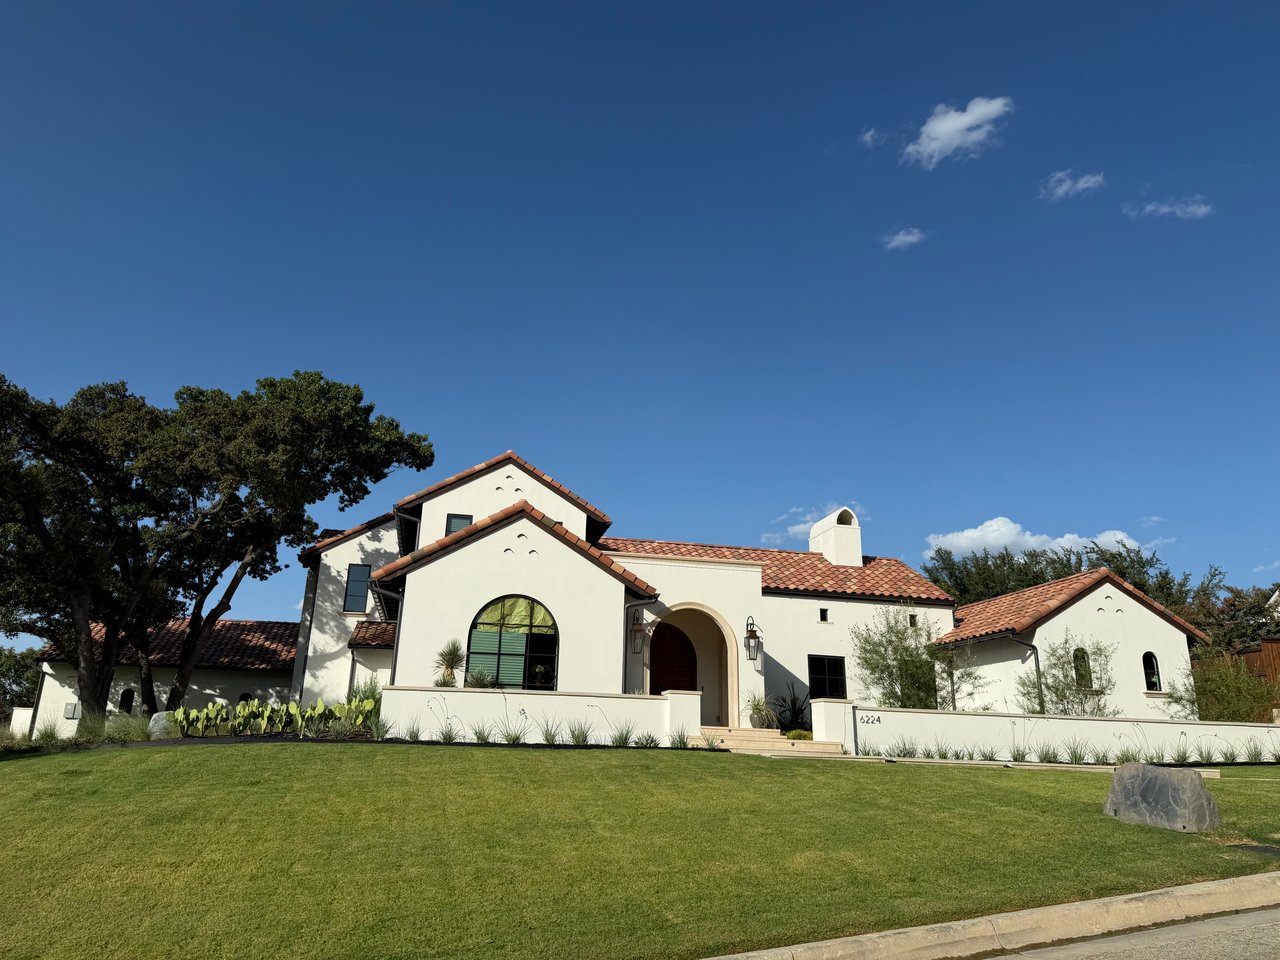
Within that, Ridgmar Estates is a small and much newer enclave — 10 sales at a median of $607,500 on 2,567 square feet, median year built 2004, and the fewest listings coming off the market of anything here. The main body of Ridgmar runs a $517,500 median on 2,347 square feet, built 1962, 28 days on market.
One warning about comps. The Ridgmar Crossroads condominiums file under the Ridgmar name in the MLS but are not part of this neighborhood, and they close at a median around $160,000 on about 1,045 square feet — under a third of a Ridgmar house. Any automated valuation that searches on the subdivision name is blending them in with 1960s houses on quarter-acre lots. I've excluded them from every figure on this page, and you should exclude them from any comparison you're handed.
Median price has moved sideways: roughly $543,000 in 2023, $550,000 in 2024, $500,000 in 2025, $522,500 in 2026. That's mostly the mix of house sizes selling in any given year rather than a change in value — on a per-foot basis Ridgmar went from about $227 in 2023 to $234 in 2026, which is steady to slightly up. Sellers' share of original list dipped to 93% in 2025 and recovered to 98% in 2026, which reads as a market that found its footing rather than one in decline.
28% of listings over three years came off the market without selling — 44 of 156. In a neighborhood of sixty-year-old houses where owners tend to have long tenure and substantial equity, that is largely what it looks like when a number doesn't materialize and the owner would rather stay than chase it.
What the market is actually doing
Worth setting the context, because Ridgmar is a good example of how a median can mislead. The median price here has drifted sideways, but that mostly tracks which size of house happened to sell in a given year. Controlling for size, price per square foot has run +1.1% a year across 98 closed sales — at p = 0.62, flat, and certainly not down.
That distinction matters if you own here, because a glance at median prices would tell you the neighborhood lost ground and it hasn't. Across the eighteen Fort Worth neighborhoods I track, not one shows a statistically significant decline in price per foot. What changed since 2022 is time on market and the number of listings that come off rather than trade. Sellers' share of original list dipped to 93% in 2025 and recovered to 98% in 2026.
Schools, taxes and the practical stuff
All 170 listings are Fort Worth ISD; confirm campus assignment for a specific address with the district. Property taxes follow the ordinary Fort Worth pattern — a combined rate near 2.19%, with no PID and no MUD. Only about 15% of homes have a pool, which is low for the price point and means one is worth more here than in neighborhoods where it's expected.
What I look at in a Ridgmar house
- What the renovation actually touched. These are sixty-year-old houses. New finishes over original wiring, cast-iron drains and a foundation nobody has assessed is a different asset from one where the expensive invisible work was done. Ask for permits, not photographs.
- Foundation and drainage. Early-1960s slabs on North Texas clay with mature trees. The most consequential inspection you'll pay for.
- Whether the plan has been opened up. Original ranch and split-level layouts are compartmentalized. It's the most common renovation here, which means unrenovated homes compete against renovated ones on the same street.
- Additions and their permits. Common, and not all were approved. Unpermitted square footage is treated differently by an appraiser than by a listing.
- Where you sit relative to 183, I-30 and the mall site, and what the truck routing is likely to be once construction starts. Today it isn't in the numbers. That doesn't mean it won't be.
If you're selling in Ridgmar
The homes that sell here go in a median of 32 days at 96.6% of original list, and sellers' share of original list recovered to 98% in 2026. A correctly positioned Ridgmar house still moves, and it moves close to asking.
The rest of the picture is that per-foot values here have been steady rather than climbing sharply — about $227 in 2023 against $234 in 2026 — while the median price swings with whatever size of house happened to sell that year. That's a reason to set the number from this neighborhood's own per-foot sales rather than from a general impression of what the last three years did, and it's a reason not to be timid either.
What works: comparables from your actual product, an honest read on where your house sits on the renovated-versus-original spectrum, and pricing the house rather than the lot. That last one is specific to Ridgmar, and it's where advice borrowed from neighboring areas goes wrong.
Buying or selling in Ridgmar
I hold a Texas broker's license and a Certified Residential Appraiser certification, which matters here for one particular reason: there is a large, uncertain external change coming to this neighborhood's front door, and measuring what external influences do to value is literally the appraisal work.
Right now the honest answer is that the warehouse project hasn't moved values. If that changes, I'd rather you heard it from someone reading the sales than from a headline.
Call or text (682) 207-4310, or send me a note.
Sales figures are medians from NTREIS listings and closed sales for the three years ending September 2026, reported in aggregate. Redevelopment plans, tax rates, school assignments and market conditions change — confirm current figures for a specific property before relying on them.