The Size of the Lot Predicts Which Houses Are Losing Value
Buyer Resources

Buyer Resources
Over the past year I've run the same analysis on about forty markets around Fort Worth: every closed sale in the MLS for three years, with a model that holds house size, lot size and build year constant so I'm comparing like with like. The point was to answer a simple question for each place — are values going up, down or nowhere?
The answers were all over the map. Crowley is down 3.6% a year. Weatherford is up 1.5%. Burleson, which borders Crowley, is flat. For months I assumed the explanation was the usual list: price point, school districts, commute, supply.
It's simpler than that, and stranger. The size of the lot predicts which houses are falling better than the town does.
I pooled 40,703 closed sales across 19 markets — Johnson, Parker, Ellis, Wise, Denton, Hood and Tarrant counties — and ran one model with a control for each market, so the comparison is inside towns rather than between them. Then I let the trend differ for houses on an acre or more:
All houses, 2023–2026 | Sales | Annual trend |
On subdivision lots (under an acre) | 32,540 | −1.10% (p < 0.001) |
On an acre or more | 8,163 | +0.93% (p = 0.006) |
A gap of about two percentage points a year, and the difference itself is significant at p < 0.001.
Restrict it to houses built in the 2020s — the ones builders have been delivering into this market — and the gap widens:
Houses built 2020 or later | Sales | Annual trend |
On subdivision lots | 11,886 | −1.36% |
On an acre or more | 3,315 | +1.99% |
New houses on small lots are losing about 1.4% a year. New houses on acreage are gaining about 2%. Three and a half points apart, in the same towns, over the same three years, at the same time.
A pooled result can hide a lot, so here's the same comparison run separately in each market where both groups had enough sales. This is houses built in the 2020s, small lots against acreage:
Market | Small lots | An acre or more |
−4.6% | +4.3% | |
−4.5% | 0.0% | |
−3.1% | −1.5% | |
−3.4% | −2.4% | |
−1.8% | +3.7% | |
−1.1% | +2.0% | |
−1.0% | +1.4% | |
−1.0% | −0.1% | |
−0.1% | +1.7% | |
+1.7% | +2.9% | |
+3.1% | +3.5% | |
+0.7% | −1.9% |
In eleven of the twelve, acreage did better than small lots. The average gap is 2.4 percentage points a year, and a paired test across the twelve markets comes back at p = 0.016. Burleson is the one reversal, on 42 acreage sales, which is too few to mean much.
These are the same towns, the same school districts, the same tax rates, the same commute, the same three years. The only thing that differs is how much ground the house sits on.
Krum and Ponder are six miles apart in western Denton County, and each has both kinds of building going on.
In Krum, houses built since 2020 on subdivision lots are down 3.07% a year (p < 0.001). The same-vintage houses on an acre or more show no measurable decline. In Ponder, subdivision houses are down 2.72% a year (p < 0.001) while the acreage side is, if anything, up.
You cannot blame the school district, because in Ponder both groups are in the same two districts. You cannot blame the town, the county, the tax rate or the drive to Fort Worth, because they're identical. The subdivision houses and the acreage houses are on opposite sides of the same city limits sign.
Aledo shows it at the biggest gap I measured: new houses on small lots down 4.6% a year, new houses on acreage up 4.3%, inside one of the most sought-after school districts in North Texas. The district premium is real — Aledo ISD is worth about 9% on a house — and it does not protect a small lot from what's happening to small lots.
I can measure the pattern. I can't prove the cause from sales data. But the explanation that fits everything I'm seeing is about supply, and it's the oldest idea in appraisal: a house can be reproduced and land cannot.
When a builder needs more product, the fastest path is more lots in the same subdivision. Fifty-foot lots, the same four plans, delivered in a few months. So when demand softens, the supply of that exact product keeps arriving anyway, and each new house competes with the ones sold last year. The buyer doesn't have to pay last year's price, because there's an identical house with a warranty down the street.
An acre doesn't work that way. Nobody manufactures more two-acre homesites near a growing town on short notice; they have to be bought, split, permitted, and served with septic and water. When that supply can't expand to meet demand, the price holds.
The land sales back this up directly. In Parker County, land prices in Weatherford rose about 14% a year over the same three years, while Springtown land fell about 6.5%. In Granbury, land is up 6–11% a year while houses are down 2.3%. When the dirt is rising and the whole property is falling, the building on it is losing value faster than the headline number suggests.
It also shows up in what the ground is worth inside a single market. Across nearly every acreage town I measured, price per foot of house climbs steadily with lot size:
Market | $/ft on a subdivision lot | $/ft on 5+ acres |
$189 | $331 | |
$184 | $302 | |
$175 | $322 | |
$184 | $347 | |
$196 | $362 |
That difference isn't better houses. It's the ground underneath them.
Two exceptions are worth more than the rule, because they show what the lot is actually standing in for.
Walsh and Morningstar. Both are in Aledo ISD. Both sit on lots of about 6,500 square feet. Both are mostly new construction. Morningstar is falling about 3.1% a year; Walsh is rising about 4.4%. The difference is what's being sold: Walsh runs about $232 a foot against Morningstar's $185, and it's marketed as a master-planned community rather than competing on price. A small lot isn't destiny. A small lot in a subdivision whose builder is competing on price is.
Azle. New houses there sell at almost exactly resale prices, which everywhere else on this list means both are falling. In Azle neither is. What Azle has that Crowley doesn't is a lake that holds up the older stock and a third of its new houses sitting on an acre or more.
And the correlation across towns, rather than within them, is only moderate (about 0.34 between a market's share of new houses on acreage and its new-construction trend). The lot is a strong signal, not the only one.
If you own a recent house on a subdivision lot, the number that matters isn't what you paid or what the neighbour listed at. It's what the builder is getting today for the same plan, net of incentives. In Godley and Justin, builders held their sticker prices and added 250 to 500 square feet instead, which means price per foot fell 7–14% while the headline price looked stable. In Midlothian and Mansfield, builders held the sticker and tripled concessions. Either way the real price moved and the listing price didn't show it.
If you own acreage, the land is the asset and it should be valued on its own, not smeared into a price per square foot of house. A house on five acres priced from a citywide per-foot figure is being underpriced by a wide margin. Ask what bare land sold for nearby, per acre, in the last year.
If you're buying, this is a real decision rather than a preference. A subdivision house is easier to sell later because the buyer pool is bigger — the acreage markets I measure run 20–30% of listings never selling, against 12–19% in the subdivision towns. You're trading liquidity for a hedge. Neither is wrong, but you should know which one you're buying.
If you're pricing anything from comparable sales, match the lot before you match anything else. A 2,200-square-foot house on 6,000 feet of dirt and the same house on two acres are not the same product, they're not in the same market, and over the last three years they haven't even moved in the same direction.
Three years is three years. This is one cycle in one region, at a time when builders were carrying unusual amounts of standing inventory and using rate buydowns and concessions to move it. If that changes, the pattern can change with it.
I'm measuring association, not proving cause. The supply explanation fits, and the land sales support it, but a lot size also correlates with age, with location inside a town, and with what kind of buyer is shopping. I've controlled for size, lot, vintage, waterfront and market. I can't control for everything.
And the acreage result rests on 8,163 sales against 32,540 on small lots, so it's the less precisely measured of the two.
What I'm confident about is the shape of it: across 19 markets and 40,000 sales, the houses losing value are on small lots, and the houses holding value are on land. That's a more useful thing to know than any single city's average.
Every market in this analysis has its own page with the full numbers: what it costs, what's rising or falling, what the land is worth, and what a comparable set actually needs to match. If you're weighing a specific property, call or text (682) 207-4310, or send me a note, and I'll tell you what the sales on your kind of lot support.
Based on NTREIS listings, closed sales and vacant land sales for the three years ending September 2026, across 19 markets in Tarrant, Johnson, Parker, Hood, Ellis, Wise and Denton counties, reported in aggregate. Trends come from log-price models controlling for house size, lot size, build year, waterfront and market. "Small lot" means under one acre. Figures are aggregate results, not valuations of any particular property. I'm a Texas broker (TREC #0686157) with Compass RE TX, LLC, and a Certified Residential Appraiser with Clearfork Appraisals. Appraisal services are provided through Clearfork Appraisals, not through Compass.
 Mira Vista
 Rivercrest, Monticello & North Hi Mount
Rivercrest Bluffs & River District
Rivercrest, Monticello & North Hi Mount
Rivercrest Bluffs & River District
 Westover Hills
 Ridgmar
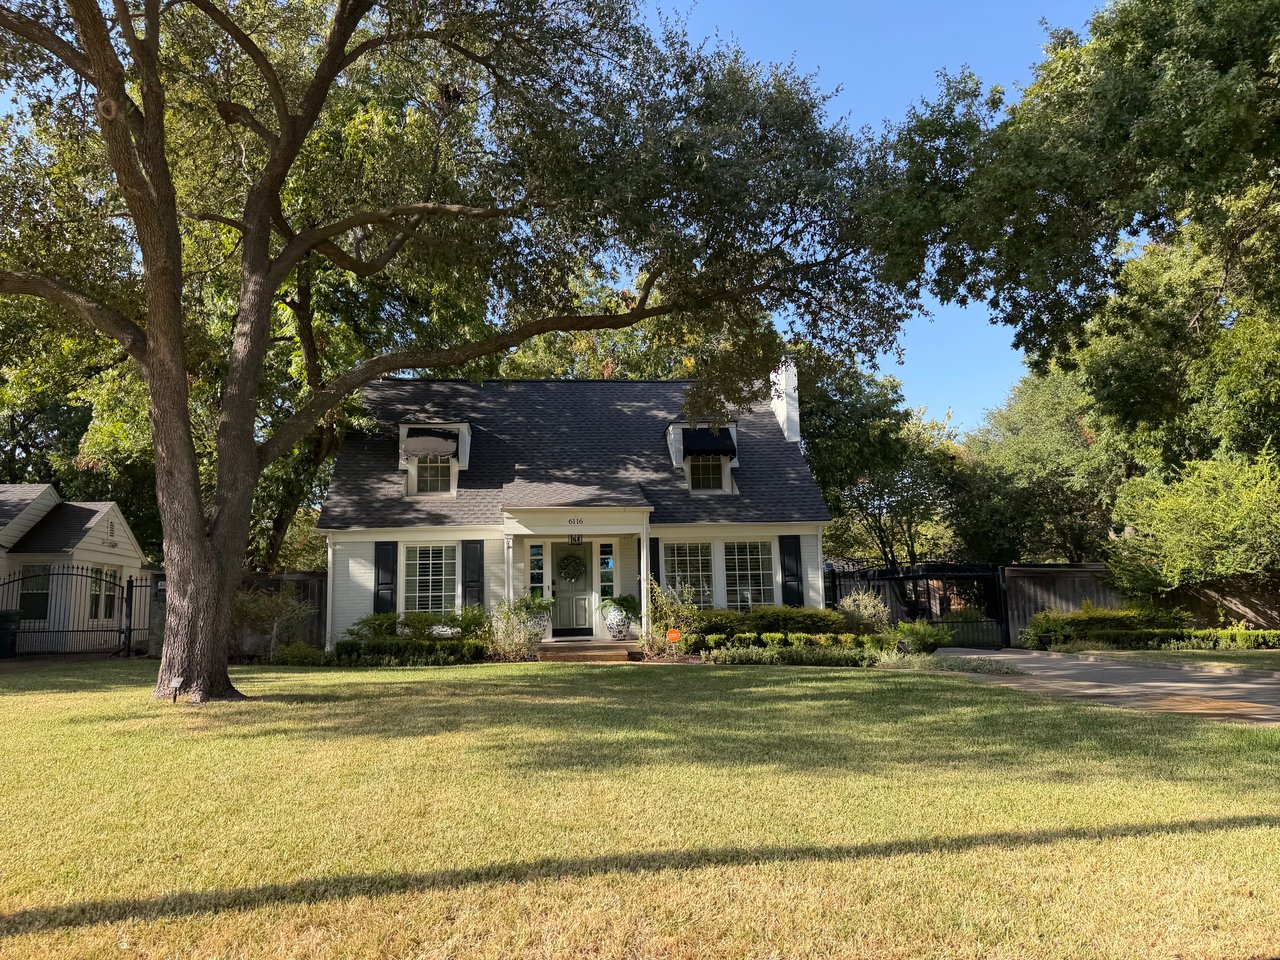 Ridglea North
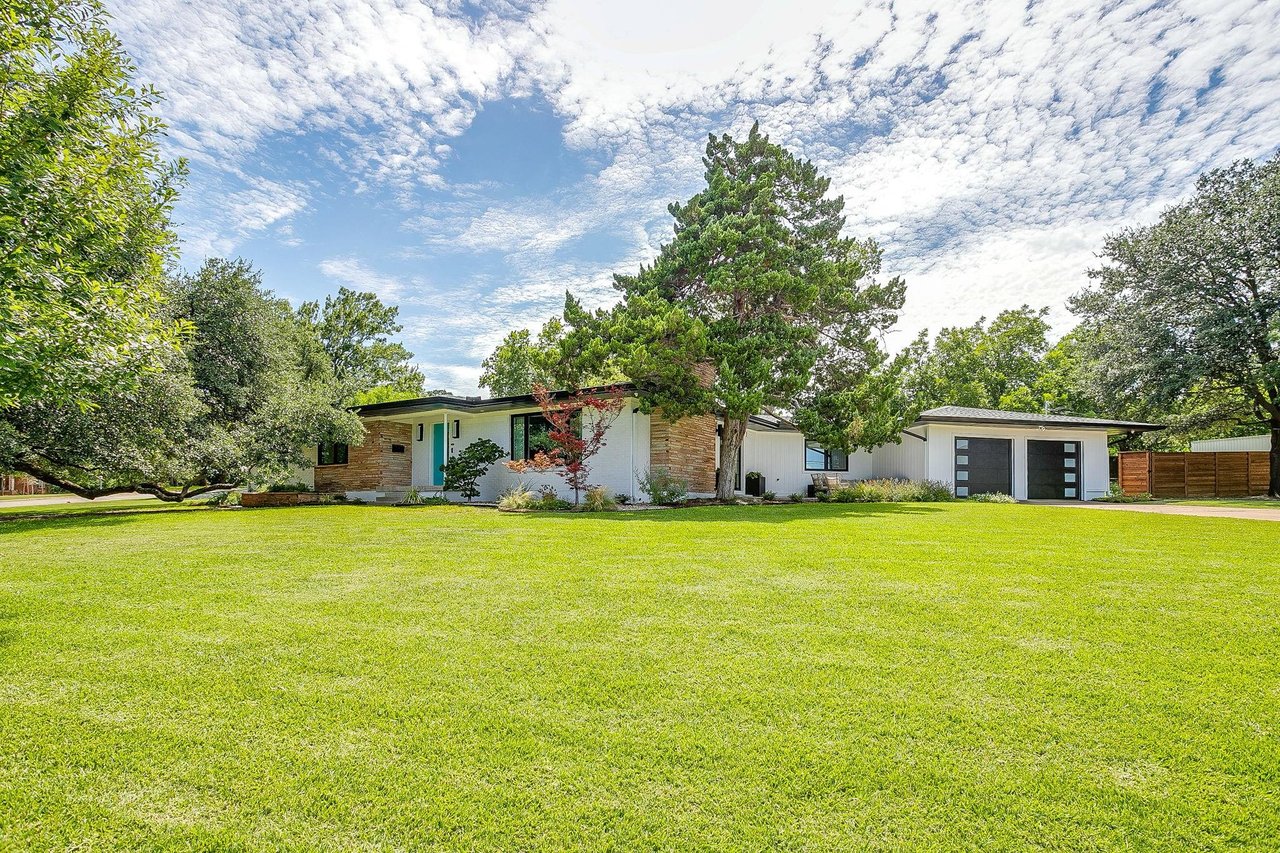 Ridglea
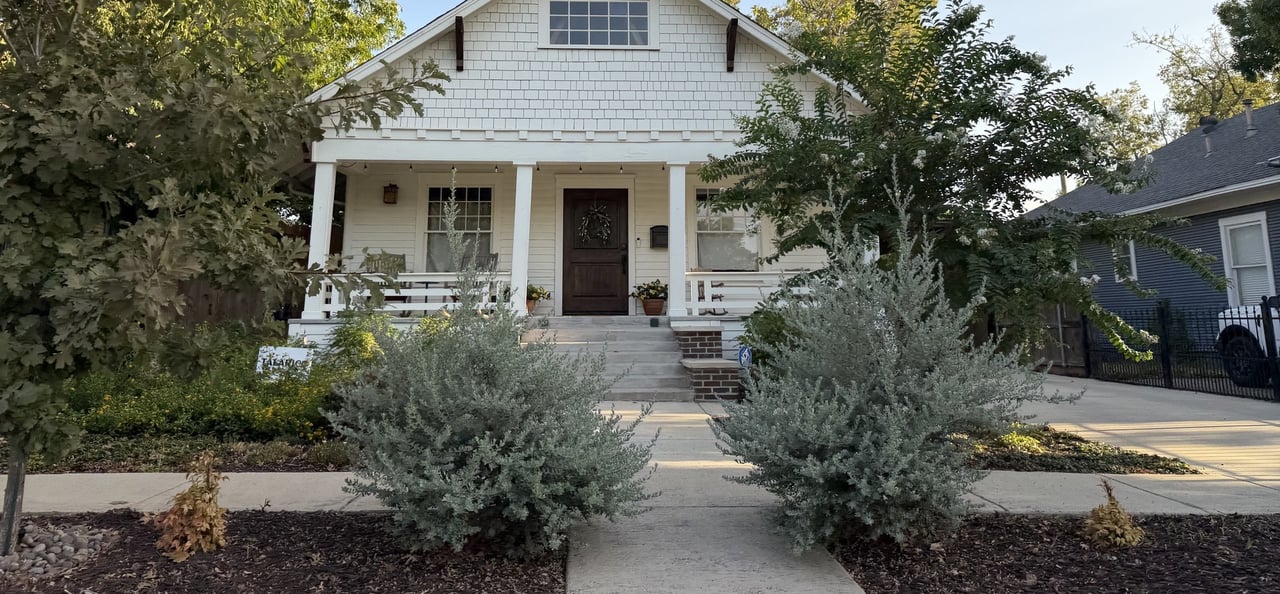 Fairmount
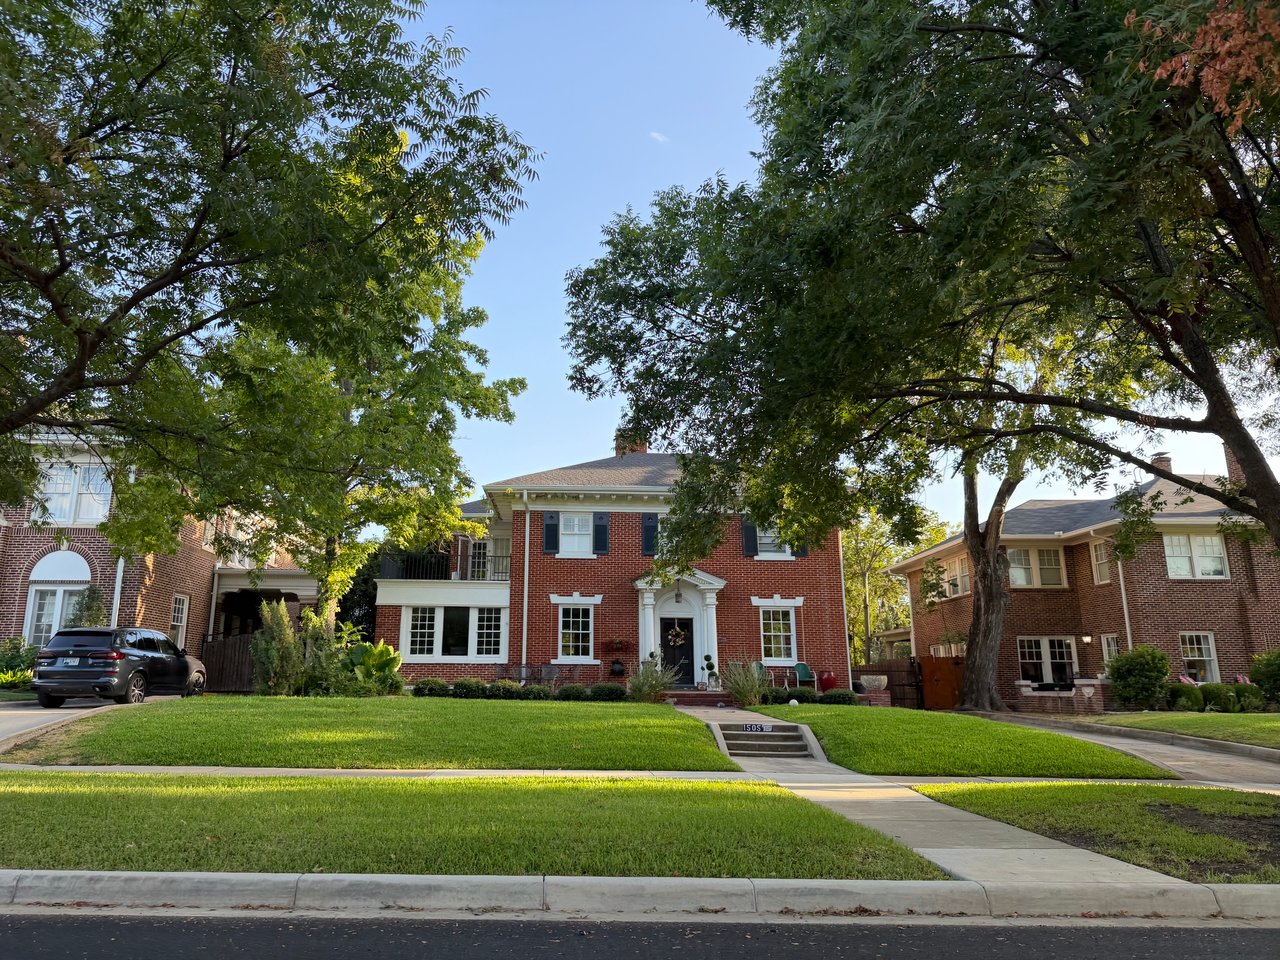 Ryan Place
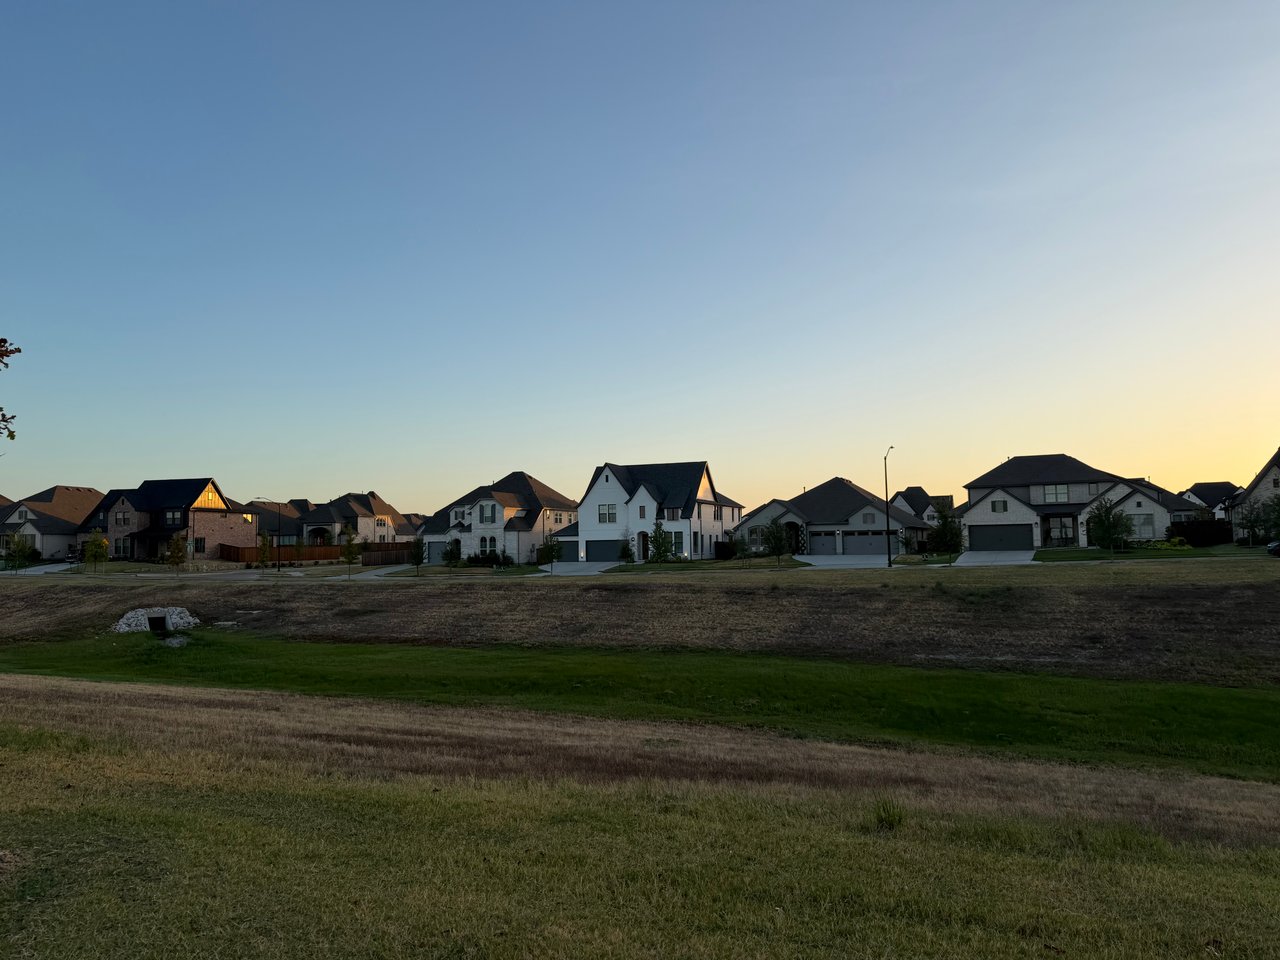 Tavolo Park
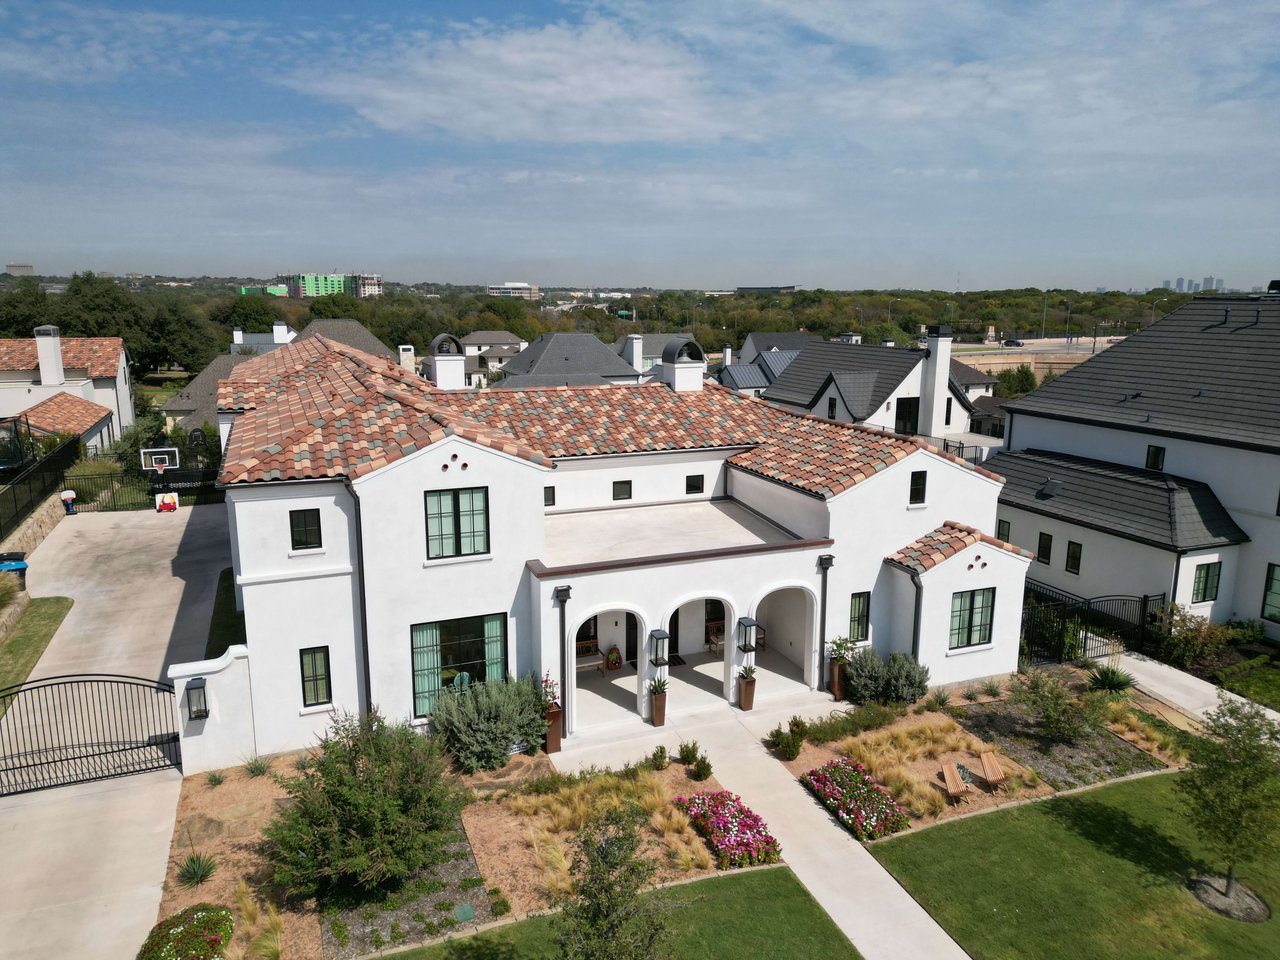 Edwards Ranch Riverhills
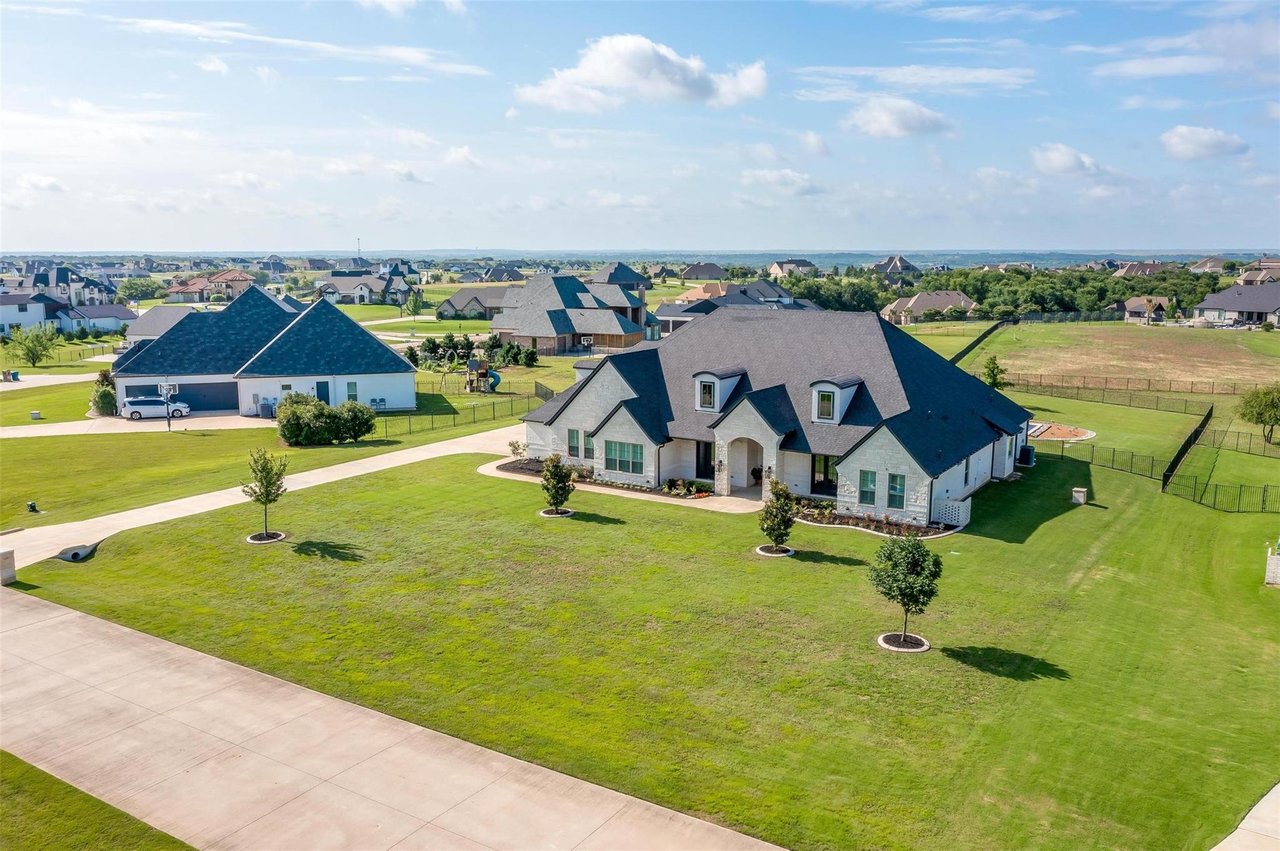 Bella Flora
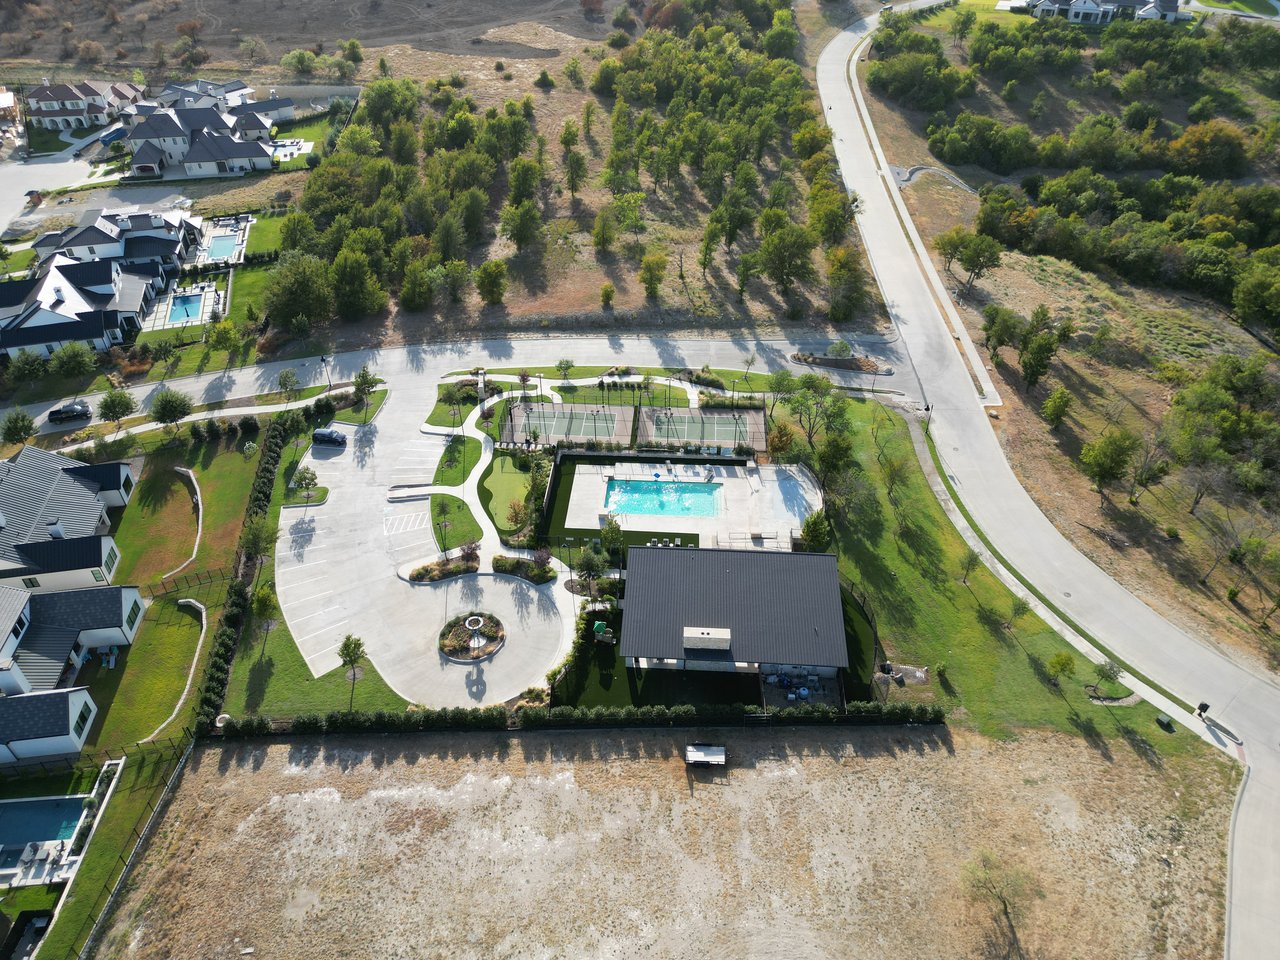 Montserrat / Montrachet
 Walsh Ranch
 Crestwood
 Tanglewood
Stay up to date on the latest real estate trends.
Buyer Resources
Across 40,703 sales in 19 markets, houses on subdivision lots are down about 1% a year while houses on an acre or more are up about 1%. The pattern holds inside the sa… Read more

Owner Resources
What 33,000 Fort Worth Sales Say About Fixing Up Before You List

Owner Resources
Nothing on this list is automatic. One of these took effect nine months ago and almost nobody has filed.
New Construction
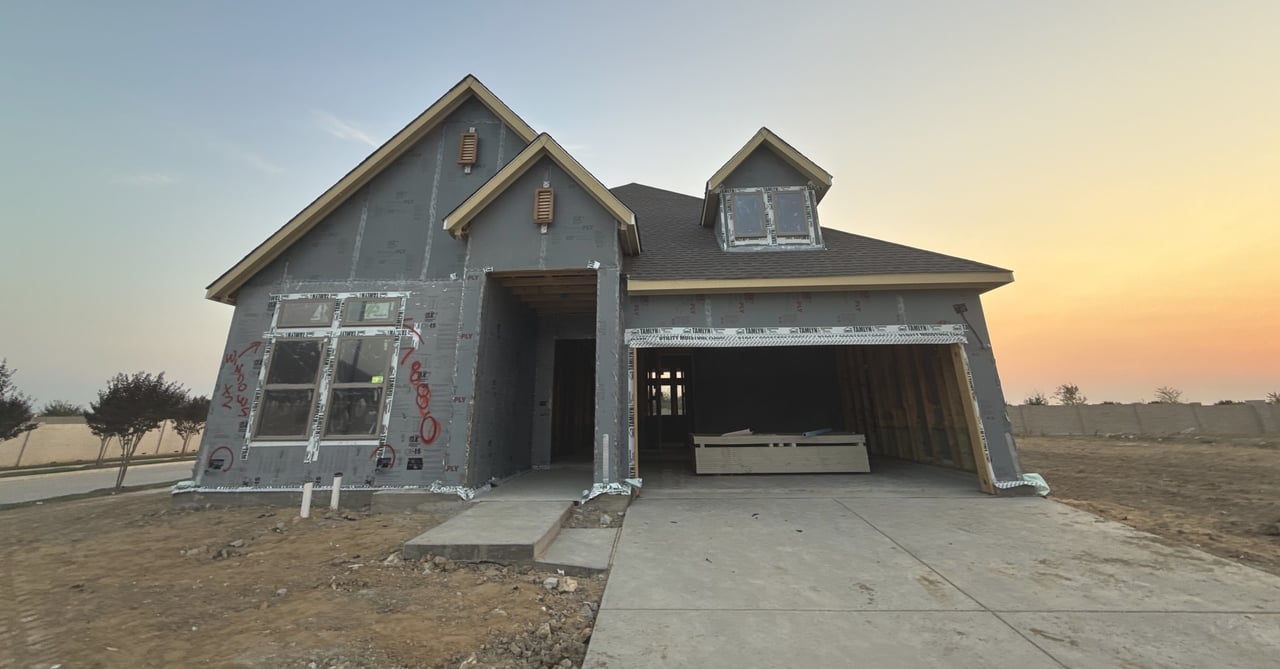
Your escrow is about to jump, your warranty is shorter than you think, and the yard has something to tell you.
New Construction
The new-home incentives are real. So are the twelve paragraphs nobody reads.
Seller Resources
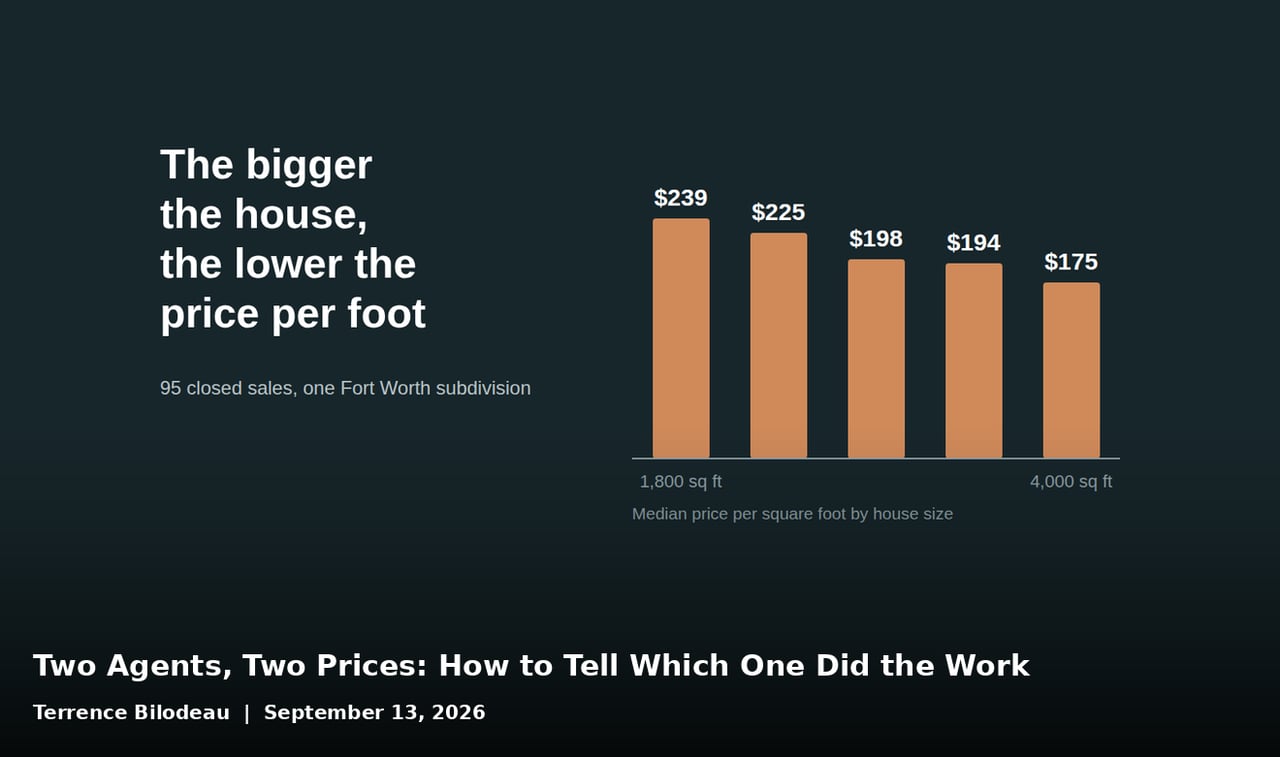
Why price per square foot misleads in a predictable direction, what a careful pricing analysis actually includes, and the four questions that separate them.
Growth
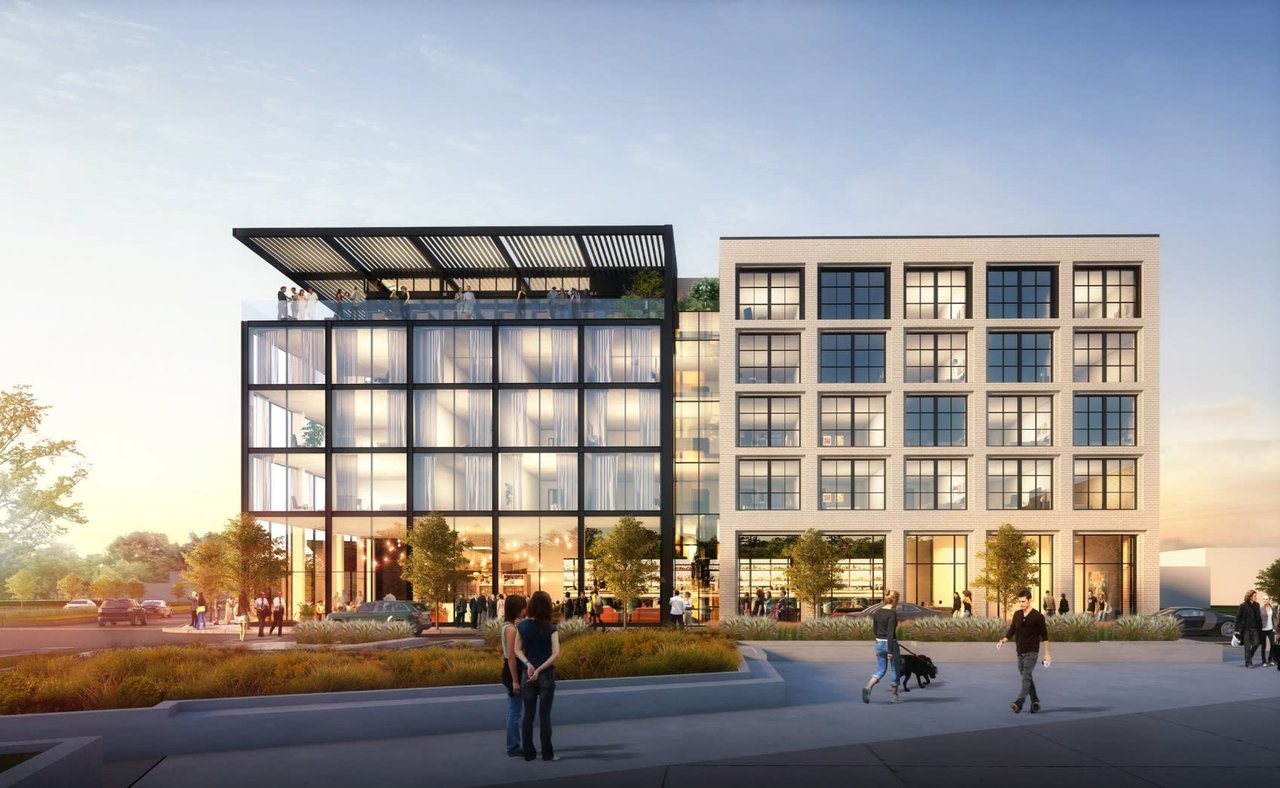
An appraiser's read on what the growth actually is, what the 2025 property tax changes really did, and what to check before you buy here.

Buyer Resources
The documents that tell you where the HOA dues are headed — and the window you have to read them.
I've trained three other appraisers in my market and also own and manage rental property in Tarrant and Dallas counties which keeps me in the know on home ownership costs, contributory value for improvements, and deriving values using the income approach for investment purposes.